Fig. A.1.
Download original image
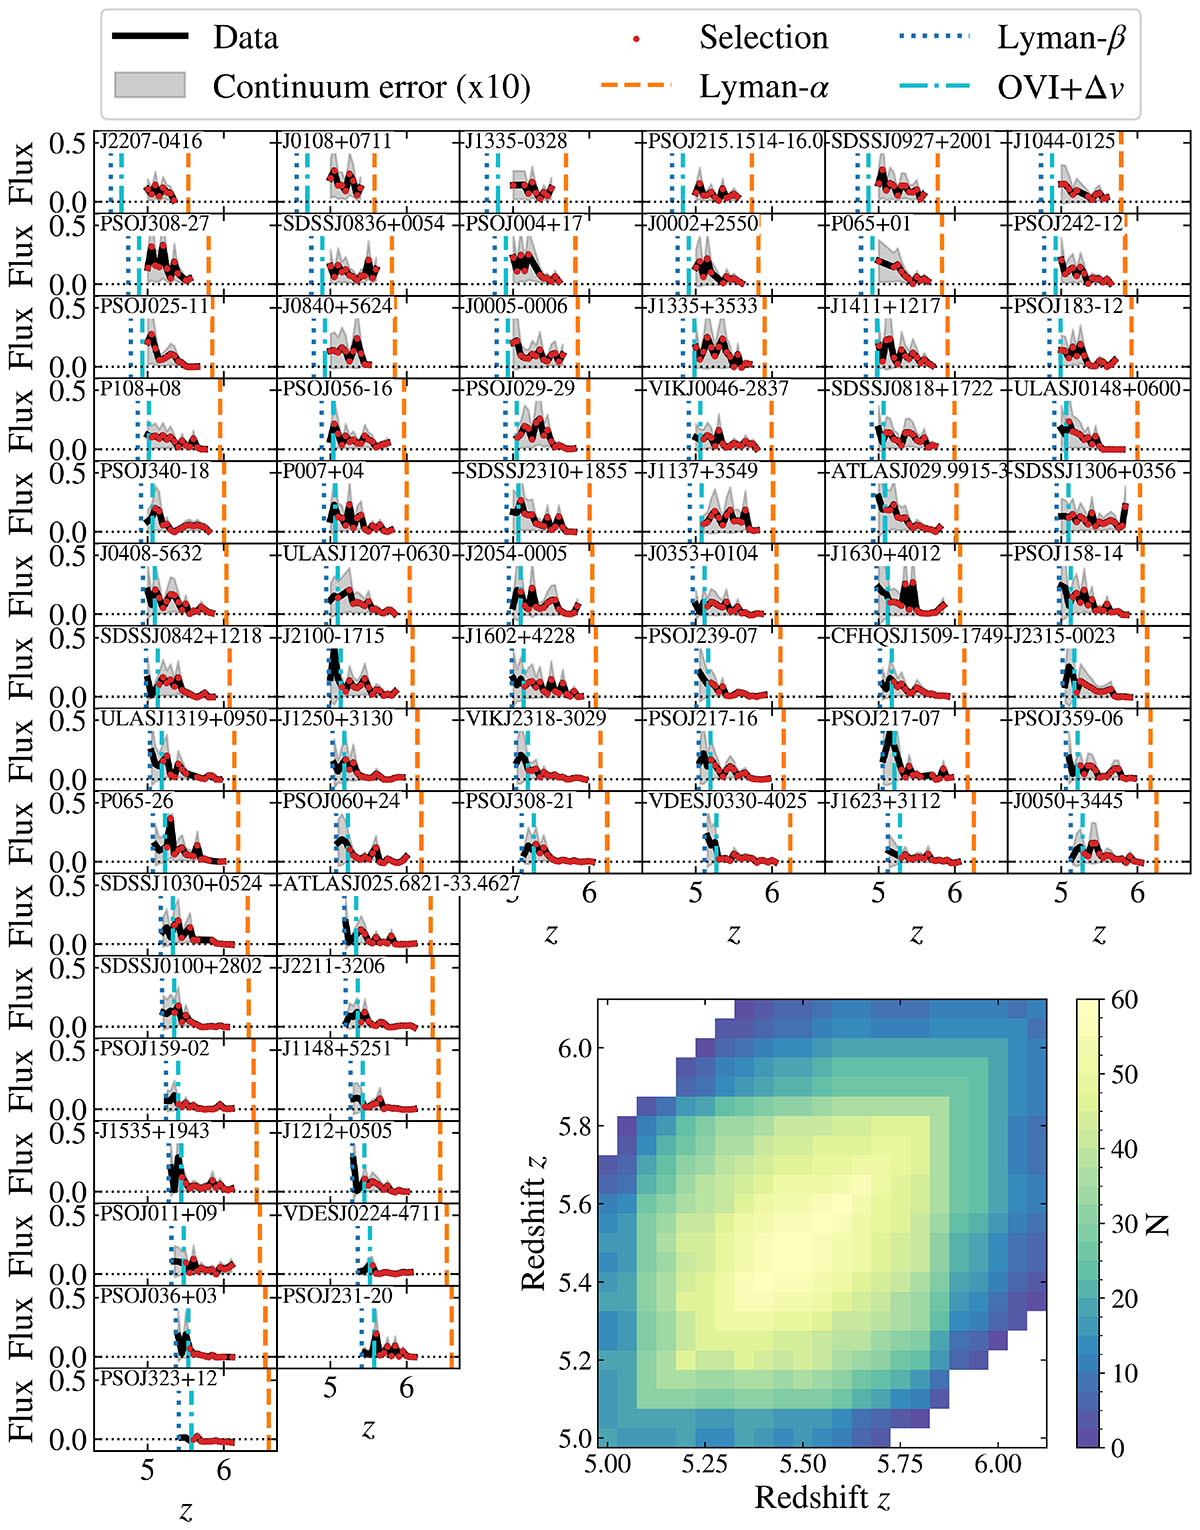
Fig. A.1: Quasar sample, as described in Sec. 2. Each quasar is displayed in a different panel, ordered by redshift, with a binning of Δz = 0.05. The detected flux as a function of redshift is shown as a black continuous line. The gray shaded region represents the continuum-reconstruction uncertainty. Data selected based on the OVI doublet emission line (semi-dashed light blue vertical line) are highlighted in red. The Lyman-α and Lyman-β lines are indicated by the dashed orange and dotted blue lines, respectively. The number of sightlines available in each redshift bin (and their combination) is reported in the bottom right panel.
Current usage metrics show cumulative count of Article Views (full-text article views including HTML views, PDF and ePub downloads, according to the available data) and Abstracts Views on Vision4Press platform.
Data correspond to usage on the plateform after 2015. The current usage metrics is available 48-96 hours after online publication and is updated daily on week days.
Initial download of the metrics may take a while.