Fig. 11.
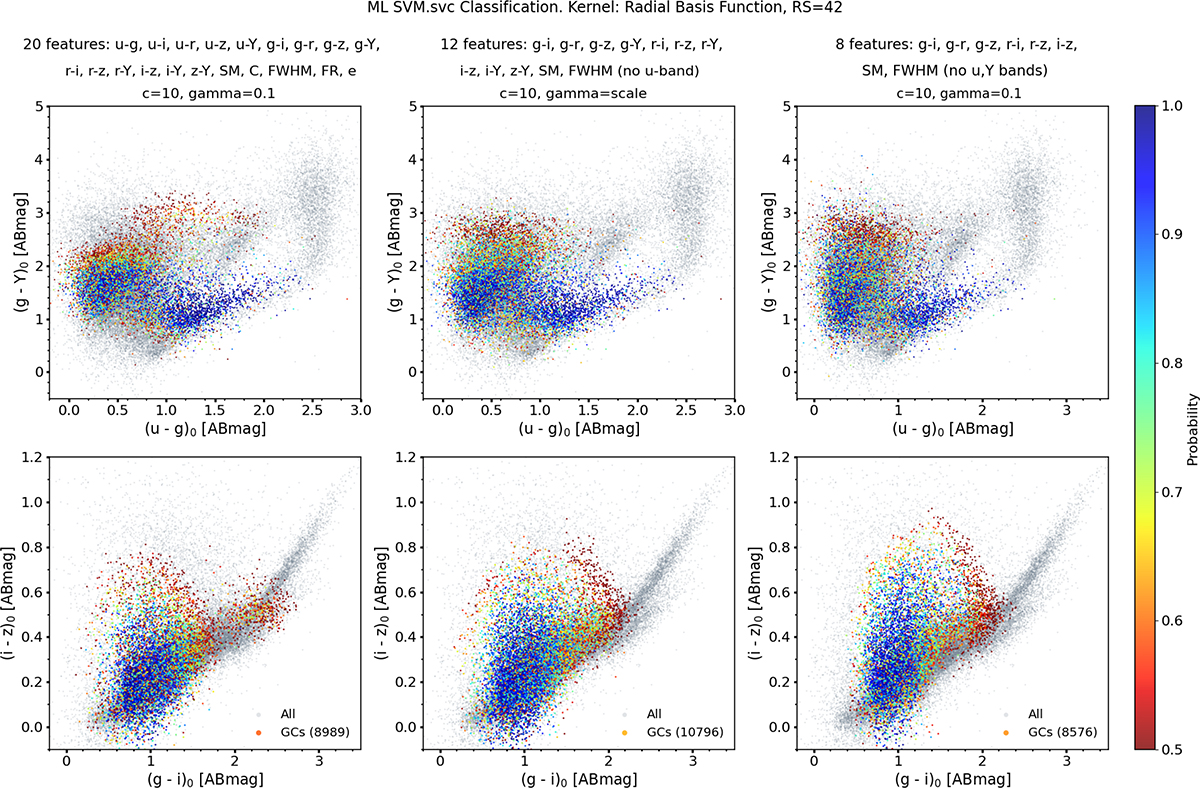
Download original image
Results of the svm.SVC model applied to the LSST filter system. The left-column panels show the 20F model (full u′g′r′i′z′Y coverage), the middle-column panels show the 12F model (excluding the u′ band), and the right-column panels show the 8F model (excluding both u′ and Y bands). The top-row panels display the u′g′Y cc–diagram, while the bottom-row panels show the g′i′z′ cc–diagram, representing the configuration without u′ and Y bands. The color scale indicates the classification probability assigned to each source, with higher values corresponding to greater confidence in the predicted class.
Current usage metrics show cumulative count of Article Views (full-text article views including HTML views, PDF and ePub downloads, according to the available data) and Abstracts Views on Vision4Press platform.
Data correspond to usage on the plateform after 2015. The current usage metrics is available 48-96 hours after online publication and is updated daily on week days.
Initial download of the metrics may take a while.