Fig. 2.
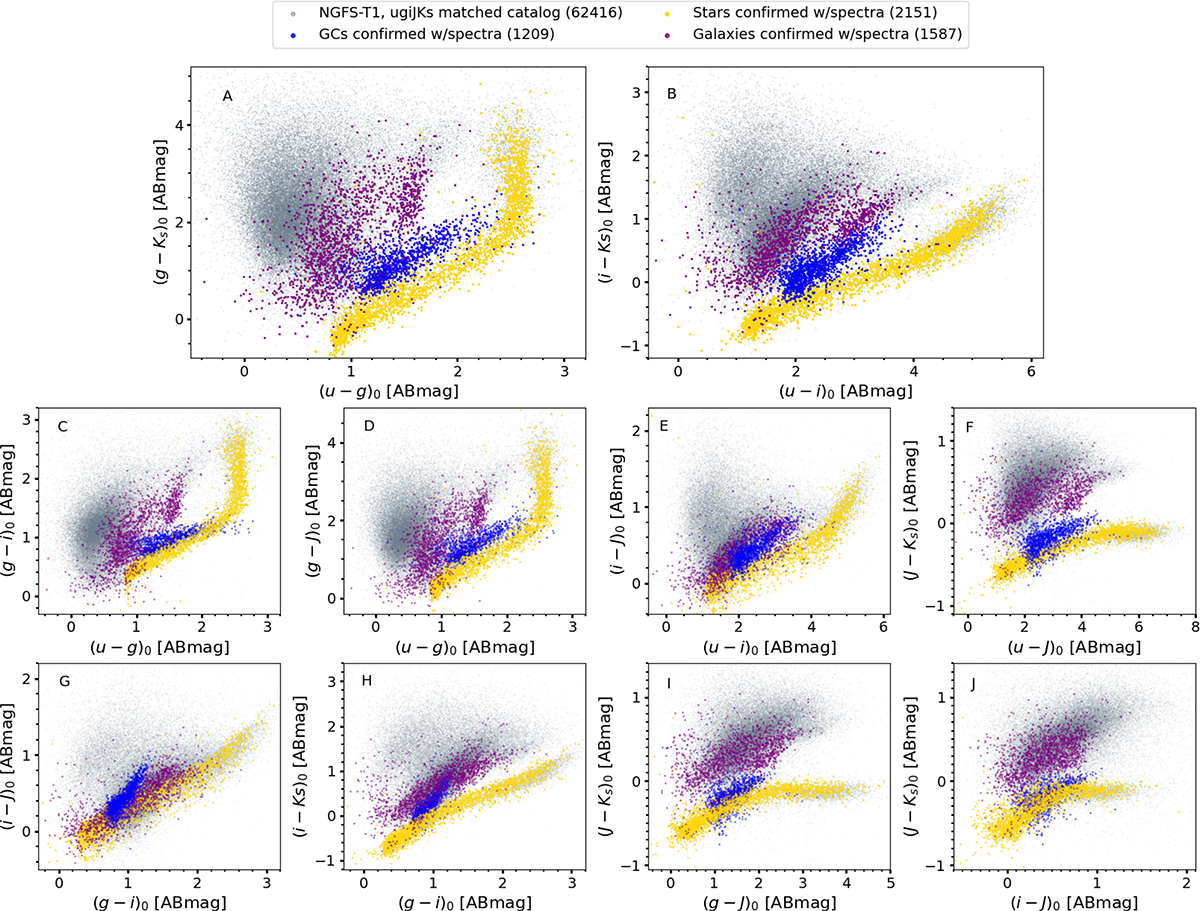
Download original image
Color-color diagrams for all sources with multiwavelength photometry in the core region of the Fornax cluster, shown as gray dots. Spectroscopically confirmed samples of GCs (blue), stars (gold), and galaxies (purple) are highlighted and used as labeled samples for the svm.SVC model (see Sect. 4.2). Note: the different panels show the same source sample, for which photometric information was obtained from the master catalog cross-matched across the u′g′i′JKs filters.
Current usage metrics show cumulative count of Article Views (full-text article views including HTML views, PDF and ePub downloads, according to the available data) and Abstracts Views on Vision4Press platform.
Data correspond to usage on the plateform after 2015. The current usage metrics is available 48-96 hours after online publication and is updated daily on week days.
Initial download of the metrics may take a while.