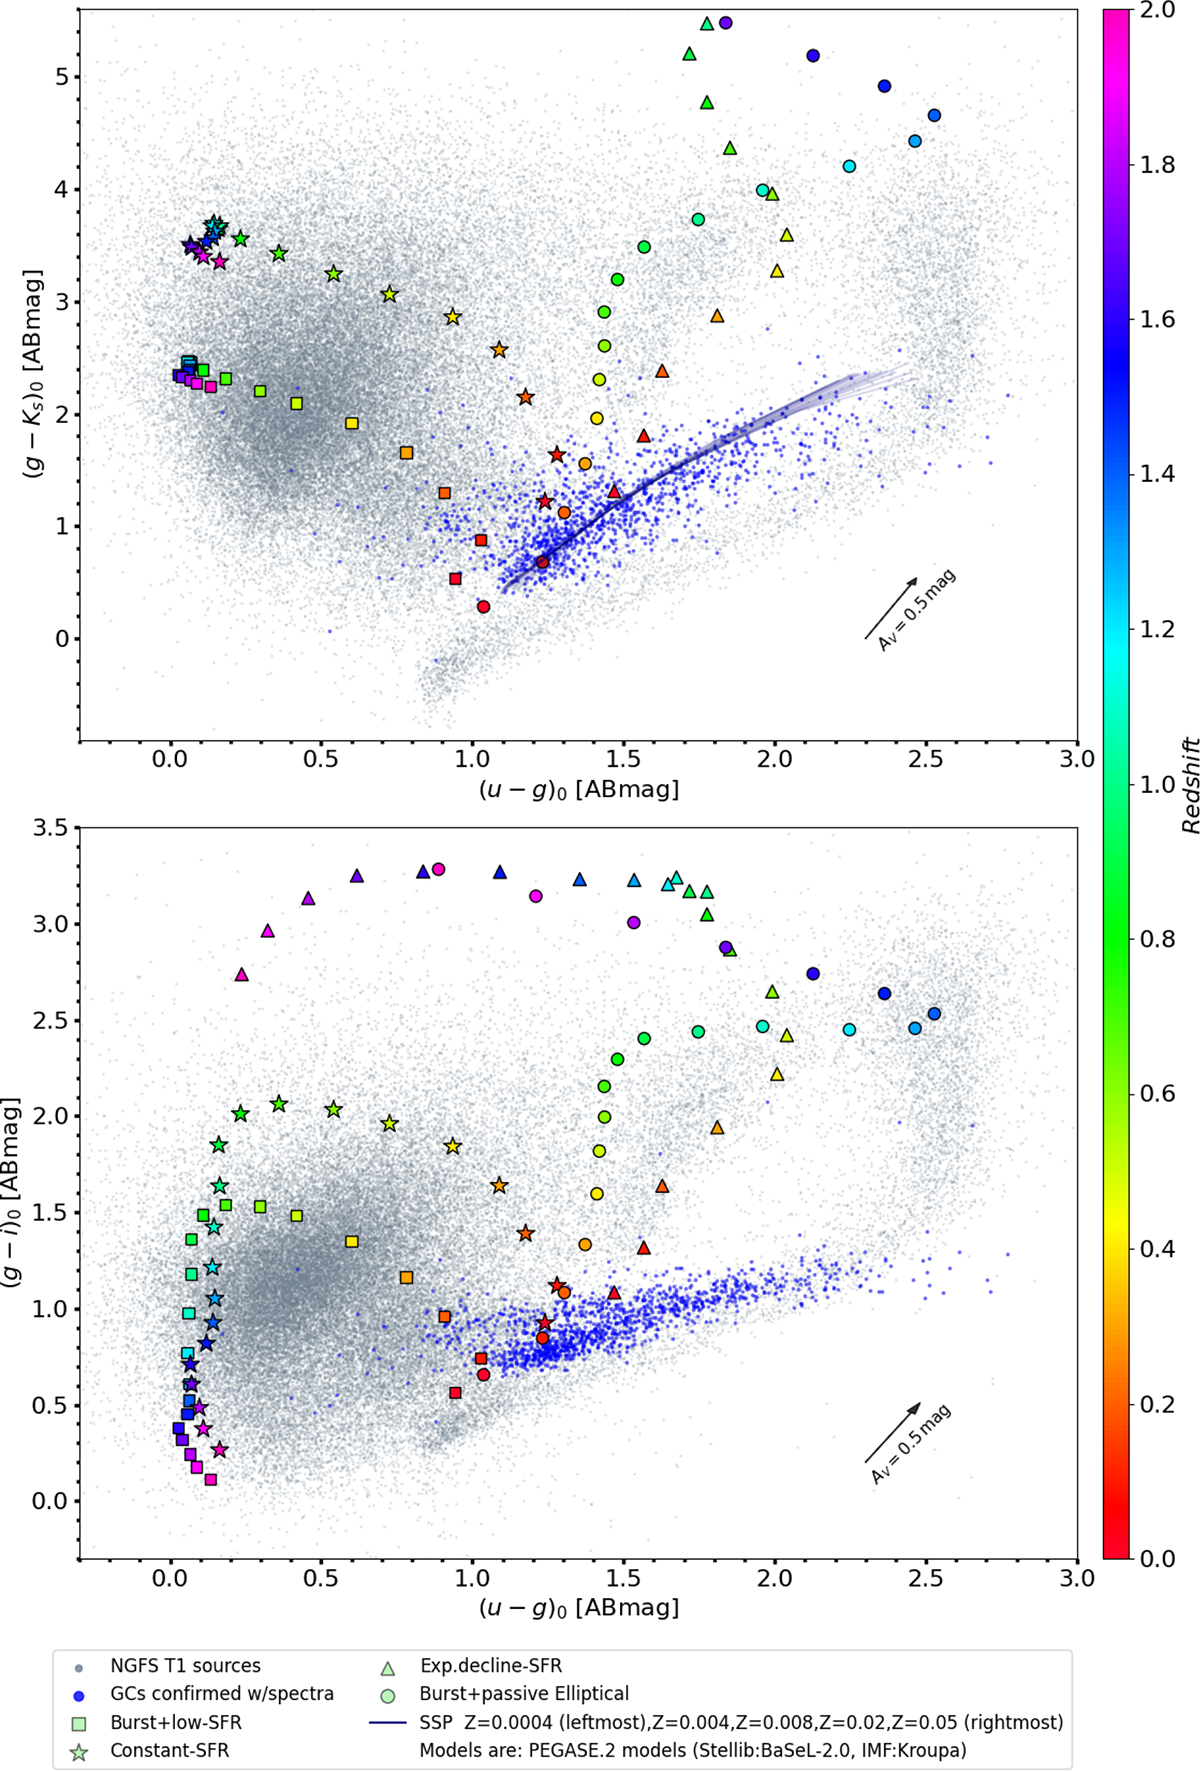
Fig. 3.
Download original image
Color–color diagrams u′g′Ks (top panel) and u′g′i′ (bottom panel) including PEGASE.2 population-synthesis models (Fioc & Rocca-Volmerange 1997). The layout is the same as in Fig. 2. In the top-panel diagram, the thin blue lines represent sequences of old single-age stellar populations at redshift zero; the corresponding metallicity range is indicated in the legend. The large colored symbols show the redshift evolution of observed colors for four galaxies formed at z = 3, each characterized by a different star-formation history: burst plus low star-formation rate (squares), constant star-formation rate (stars), exponentially declining star-formation rate (triangles), and burst followed by passive evolution (elliptical; circles).
Current usage metrics show cumulative count of Article Views (full-text article views including HTML views, PDF and ePub downloads, according to the available data) and Abstracts Views on Vision4Press platform.
Data correspond to usage on the plateform after 2015. The current usage metrics is available 48-96 hours after online publication and is updated daily on week days.
Initial download of the metrics may take a while.