Fig. 5.
Download original image
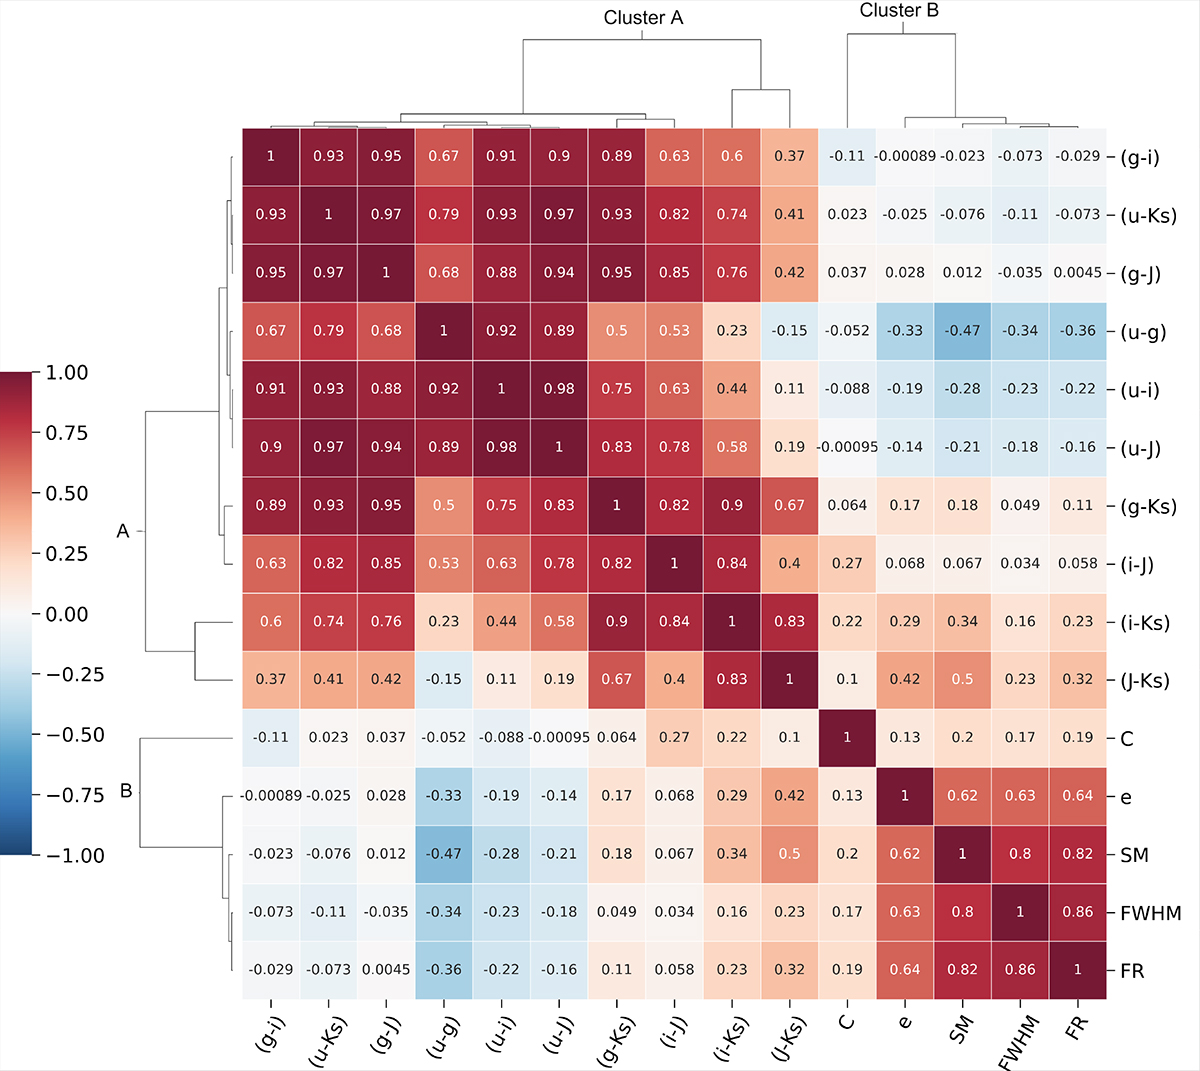
Clustermap correlation for the 15 input features. The correlation matrix displays the numerical correlation coefficients in each cell, with a color scale ranging from −1 to 1, where 0 indicates no correlation (white), −1 indicates linear anticorrelation (blue), and 1 indicates linear correlation (red). The dendrogram reveals two main feature clusters: cluster A, composed of color indices, and cluster B, composed of morpho-parameters.
Current usage metrics show cumulative count of Article Views (full-text article views including HTML views, PDF and ePub downloads, according to the available data) and Abstracts Views on Vision4Press platform.
Data correspond to usage on the plateform after 2015. The current usage metrics is available 48-96 hours after online publication and is updated daily on week days.
Initial download of the metrics may take a while.