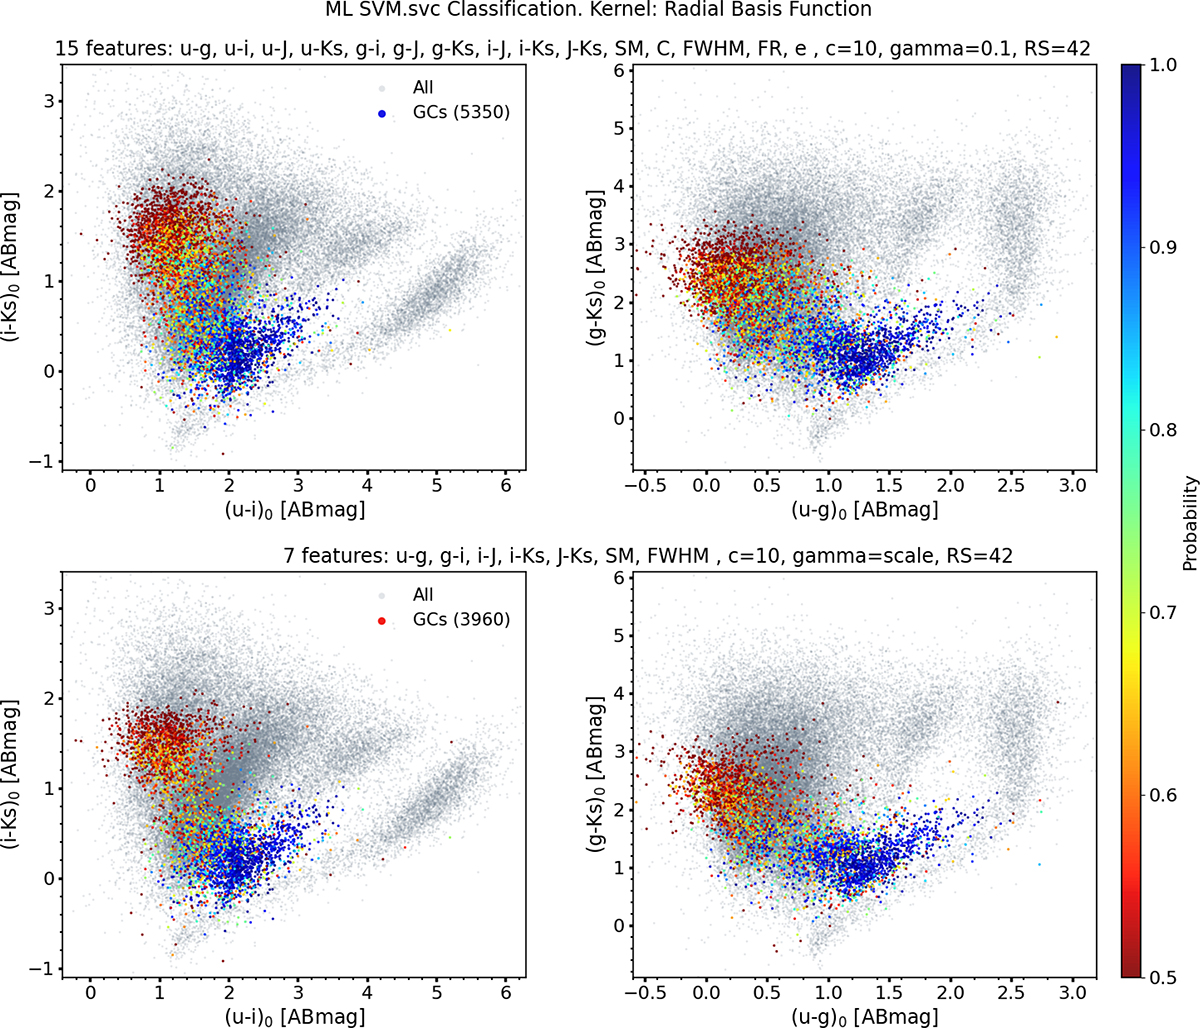
Fig. 7.
Download original image
Results of the svm.SVC model applied to the full NGFS-T1 catalog using the 15F (top panels) and 7F (bottom panels; see Sects. 4.4 and 5). The two cc–diagrams shown are u′i′Ks (first column) and u′g′Ks (second column). The color scale represents the model assigned probability of each source being classified as a GC, ranging from 50% (red) to 100% (blue). Probabilities are computed in the full feature space; therefore, these diagrams provide 2D projections intended solely for visualization purposes.
Current usage metrics show cumulative count of Article Views (full-text article views including HTML views, PDF and ePub downloads, according to the available data) and Abstracts Views on Vision4Press platform.
Data correspond to usage on the plateform after 2015. The current usage metrics is available 48-96 hours after online publication and is updated daily on week days.
Initial download of the metrics may take a while.