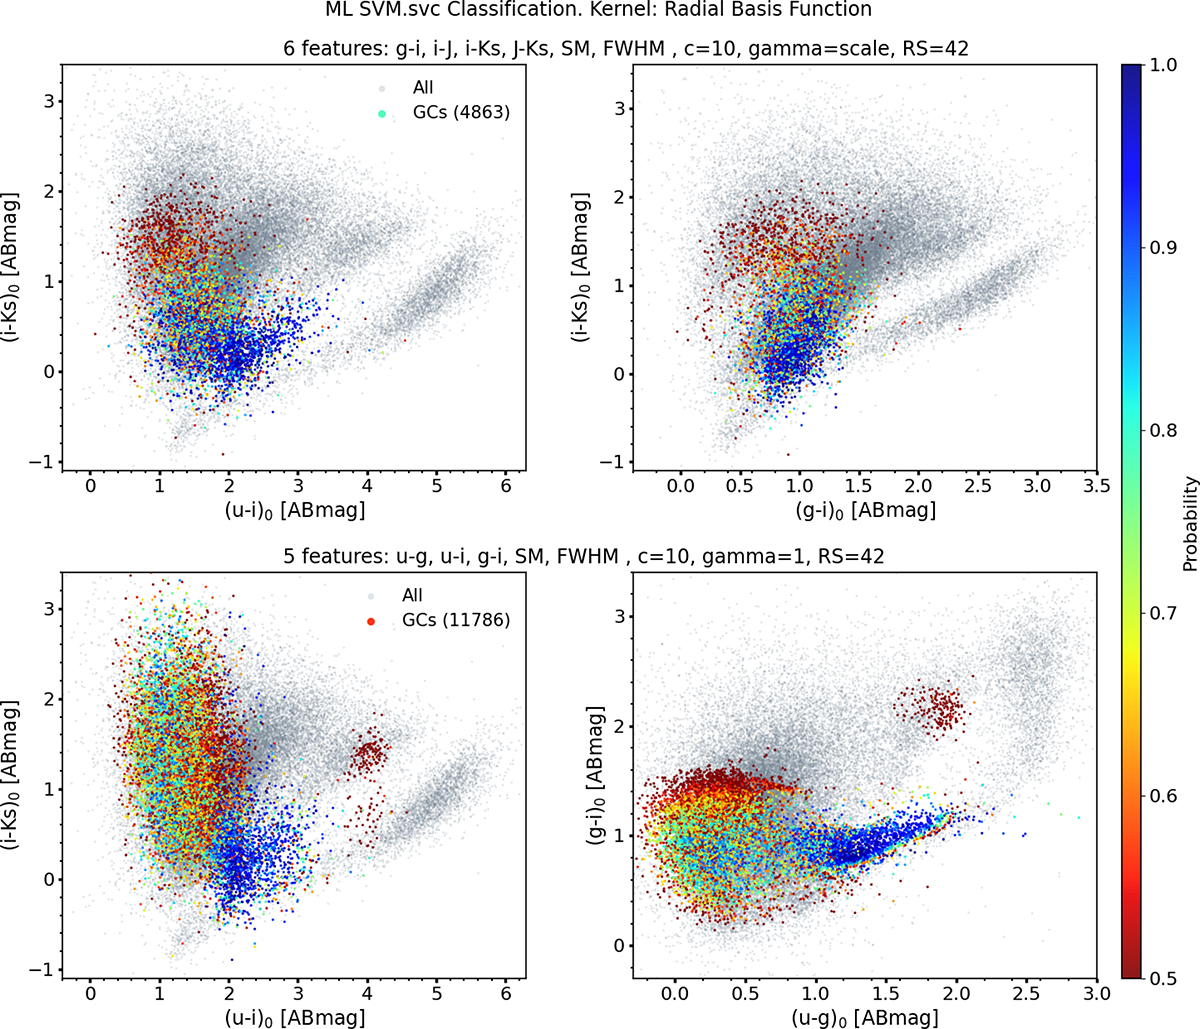
Fig. 8.
Download original image
Classification results of the svm.SVC model using different color configurations. Top row: model excluding the u′-band. Bottom row: model excluding the NIR bands. The left-column panels show the corresponding u′i′Ks cc–diagrams, while the right-column panels display cc–diagrams tailored to each model configuration: g′i′Ks for the top row and u′g′i′ for the bottom row.
Current usage metrics show cumulative count of Article Views (full-text article views including HTML views, PDF and ePub downloads, according to the available data) and Abstracts Views on Vision4Press platform.
Data correspond to usage on the plateform after 2015. The current usage metrics is available 48-96 hours after online publication and is updated daily on week days.
Initial download of the metrics may take a while.