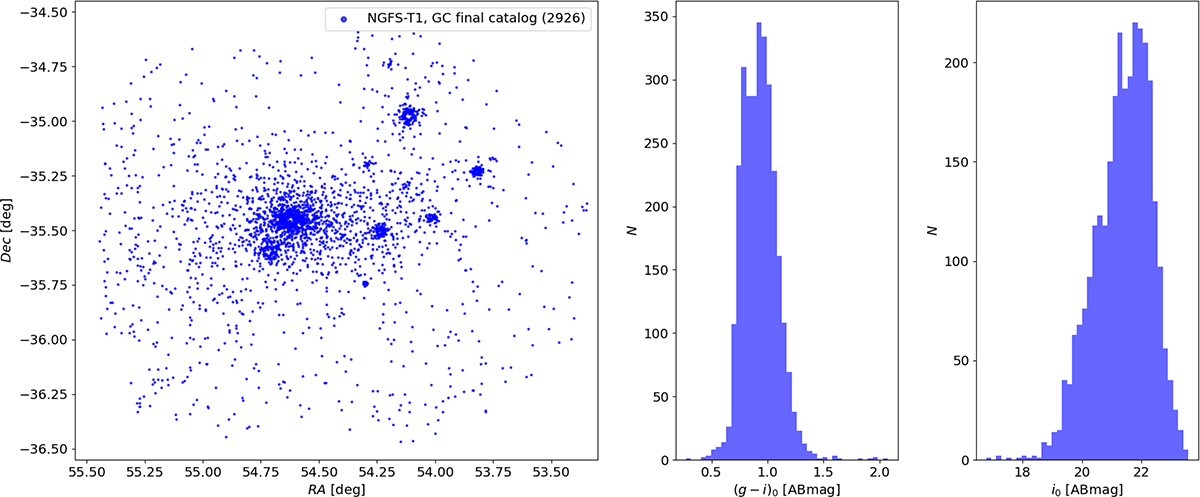
Fig. 9.
Download original image
Final GC catalog obtained from the svm.SVC classification model (7F), including spectroscopically RV-confirmed objects. Left panel: projected spatial distribution of GCs, with the highest densities concentrated around NGC 1399 and other massive galaxies. Middle panel: (g′−i′) color distribution. Right panel: i′-band magnitude distribution.
Current usage metrics show cumulative count of Article Views (full-text article views including HTML views, PDF and ePub downloads, according to the available data) and Abstracts Views on Vision4Press platform.
Data correspond to usage on the plateform after 2015. The current usage metrics is available 48-96 hours after online publication and is updated daily on week days.
Initial download of the metrics may take a while.