Fig. 6
Download original image
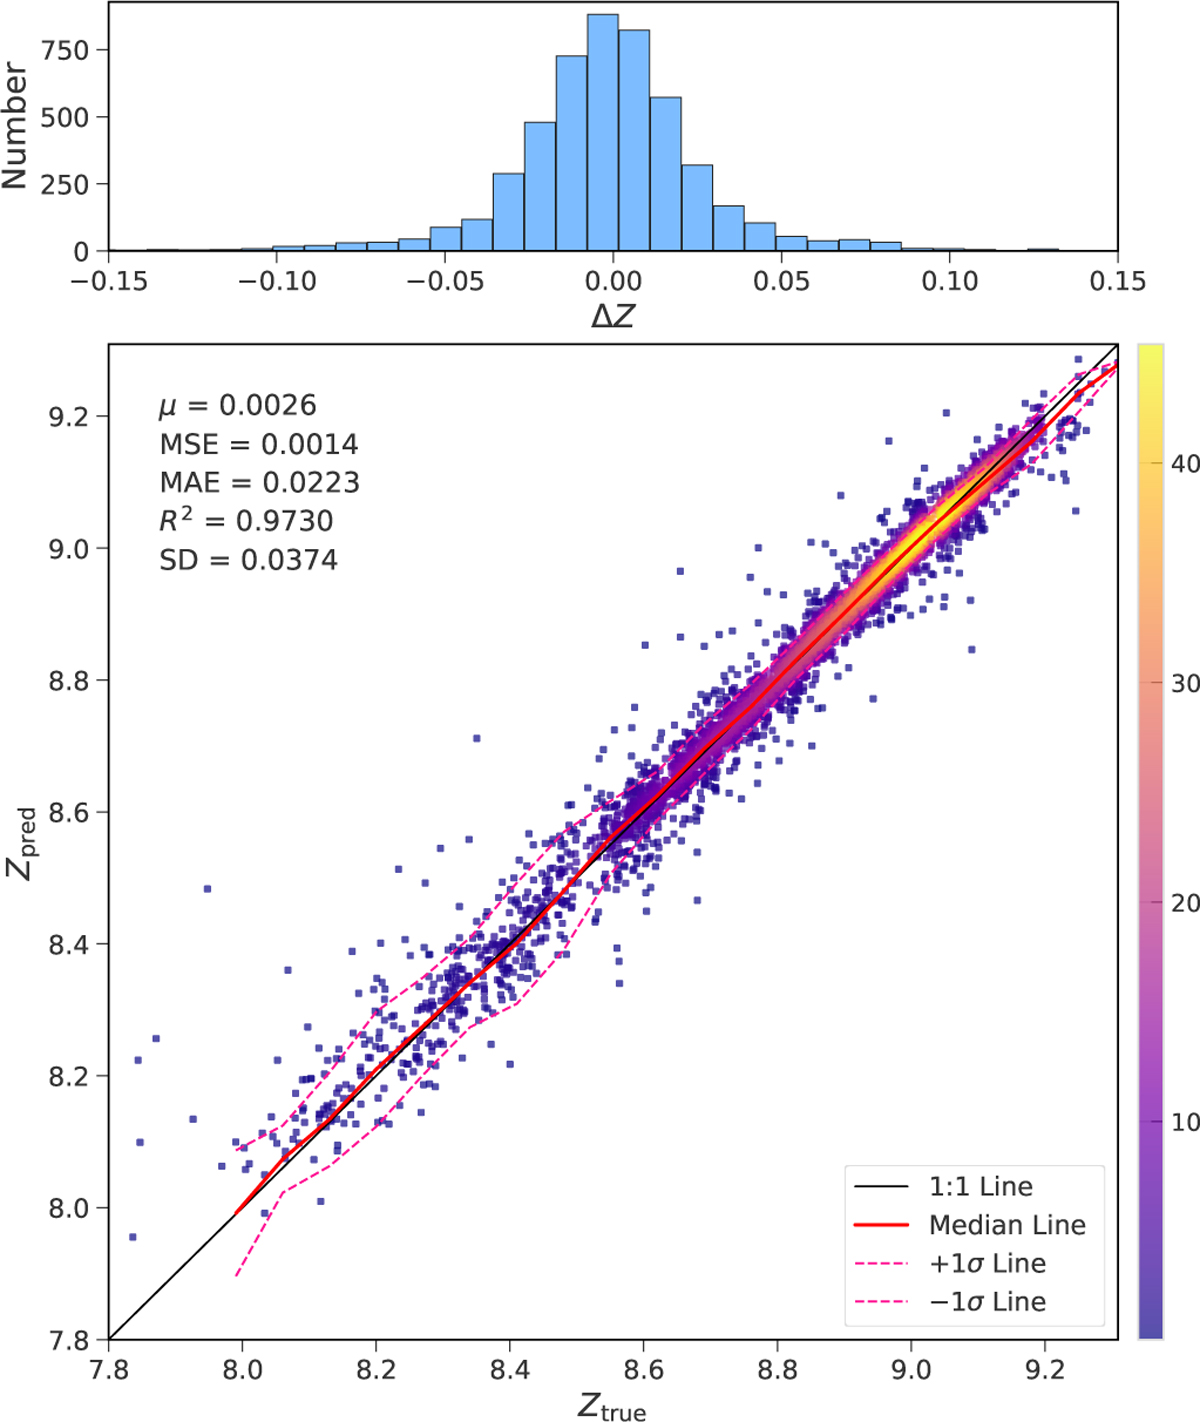
Comparison of gas-phase metallicity predictions (Zpred) from the MTLforGalSpecZ model with true values (Ztrue) for star-forming galaxies. The main panel shows a scatter density plot of gas-phase metallicity: the solid black line indicates the 1:1 relation, the red line shows the median predicted metallicity against the true value, and the dashed purple lines represent the 1σ scatter around the median. The top panel shows the residual distribution (∆Z = Zpred - Ztrue ).
Current usage metrics show cumulative count of Article Views (full-text article views including HTML views, PDF and ePub downloads, according to the available data) and Abstracts Views on Vision4Press platform.
Data correspond to usage on the plateform after 2015. The current usage metrics is available 48-96 hours after online publication and is updated daily on week days.
Initial download of the metrics may take a while.