Fig. 9
Download original image
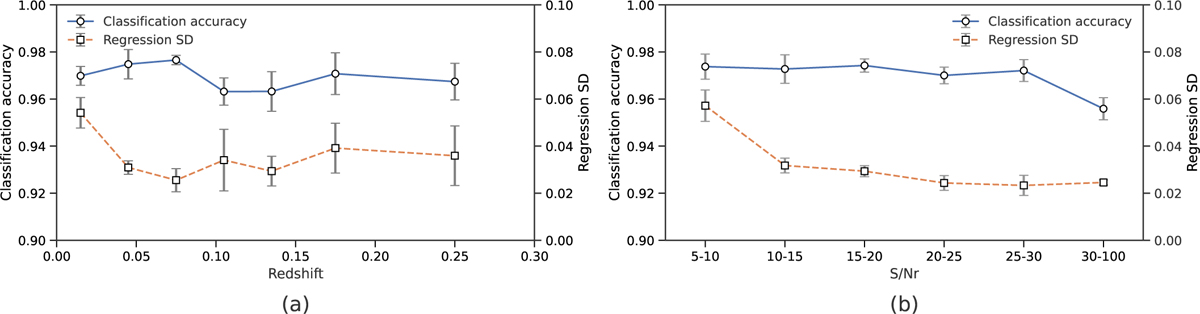
Model performance across different redshift (a) and signal-to-noise ratio in the r-band (S/Nr) intervals (b). In each panel, the solid blue line represents spectral classification accuracy, while the dashed yellow line indicates the standard deviation (σ) of gas-phase metallicity predictions (∆ = Zpred - Ztrue). Error bars in each interval denote the standard deviation of the prediction error, and black circles indicate the median standard deviation within each bin.
Current usage metrics show cumulative count of Article Views (full-text article views including HTML views, PDF and ePub downloads, according to the available data) and Abstracts Views on Vision4Press platform.
Data correspond to usage on the plateform after 2015. The current usage metrics is available 48-96 hours after online publication and is updated daily on week days.
Initial download of the metrics may take a while.