Fig. 1.
Download original image
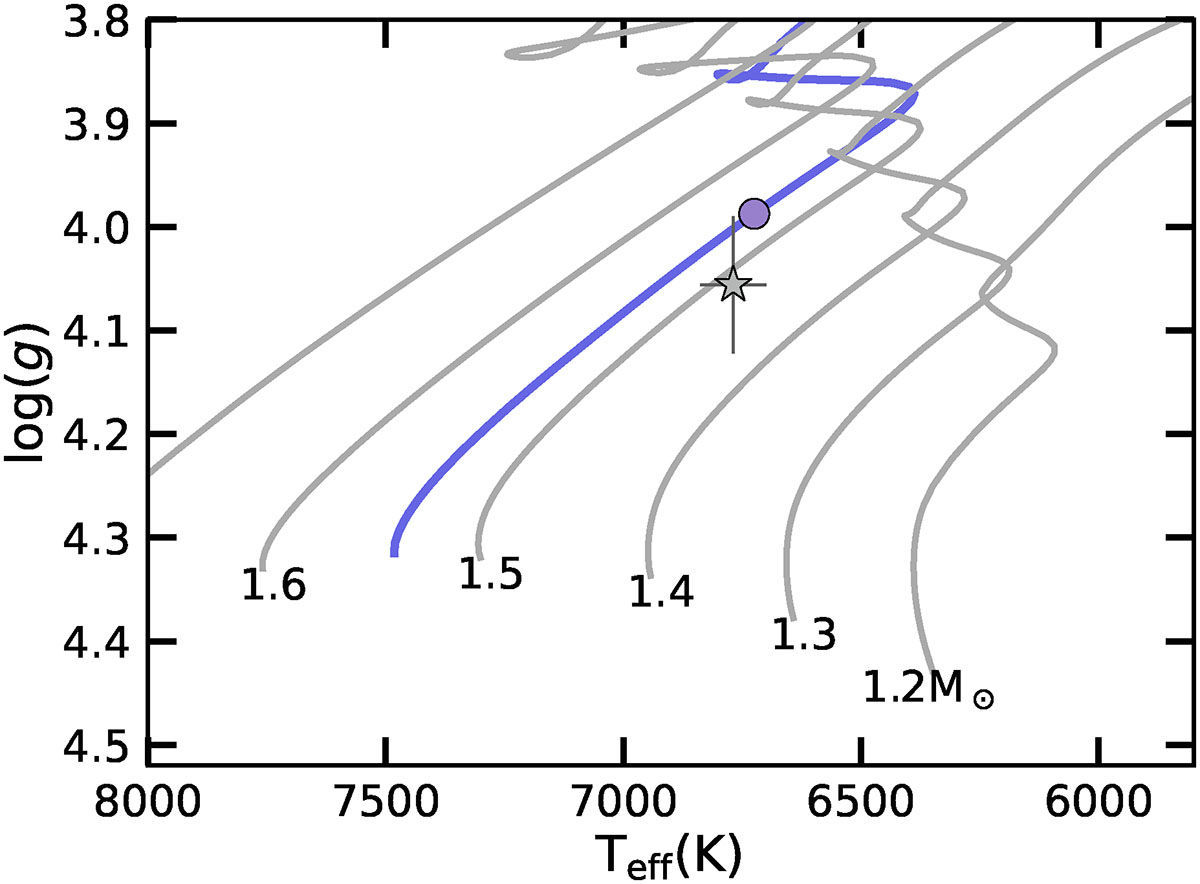
Kiel diagram showing computed evolutionary tracks with metallicity [M/H]i = 0.0 and Yi = 0.26 (solar composition) as solid gray lines. The star symbol marks the location of Procyon A in the diagram. The solid blue line represents the evolutionary track of the best model (circle symbol) from the r02 test, considering the radius in the inference of scenario A.
Current usage metrics show cumulative count of Article Views (full-text article views including HTML views, PDF and ePub downloads, according to the available data) and Abstracts Views on Vision4Press platform.
Data correspond to usage on the plateform after 2015. The current usage metrics is available 48-96 hours after online publication and is updated daily on week days.
Initial download of the metrics may take a while.