Open Access
Fig. 5.
Download original image
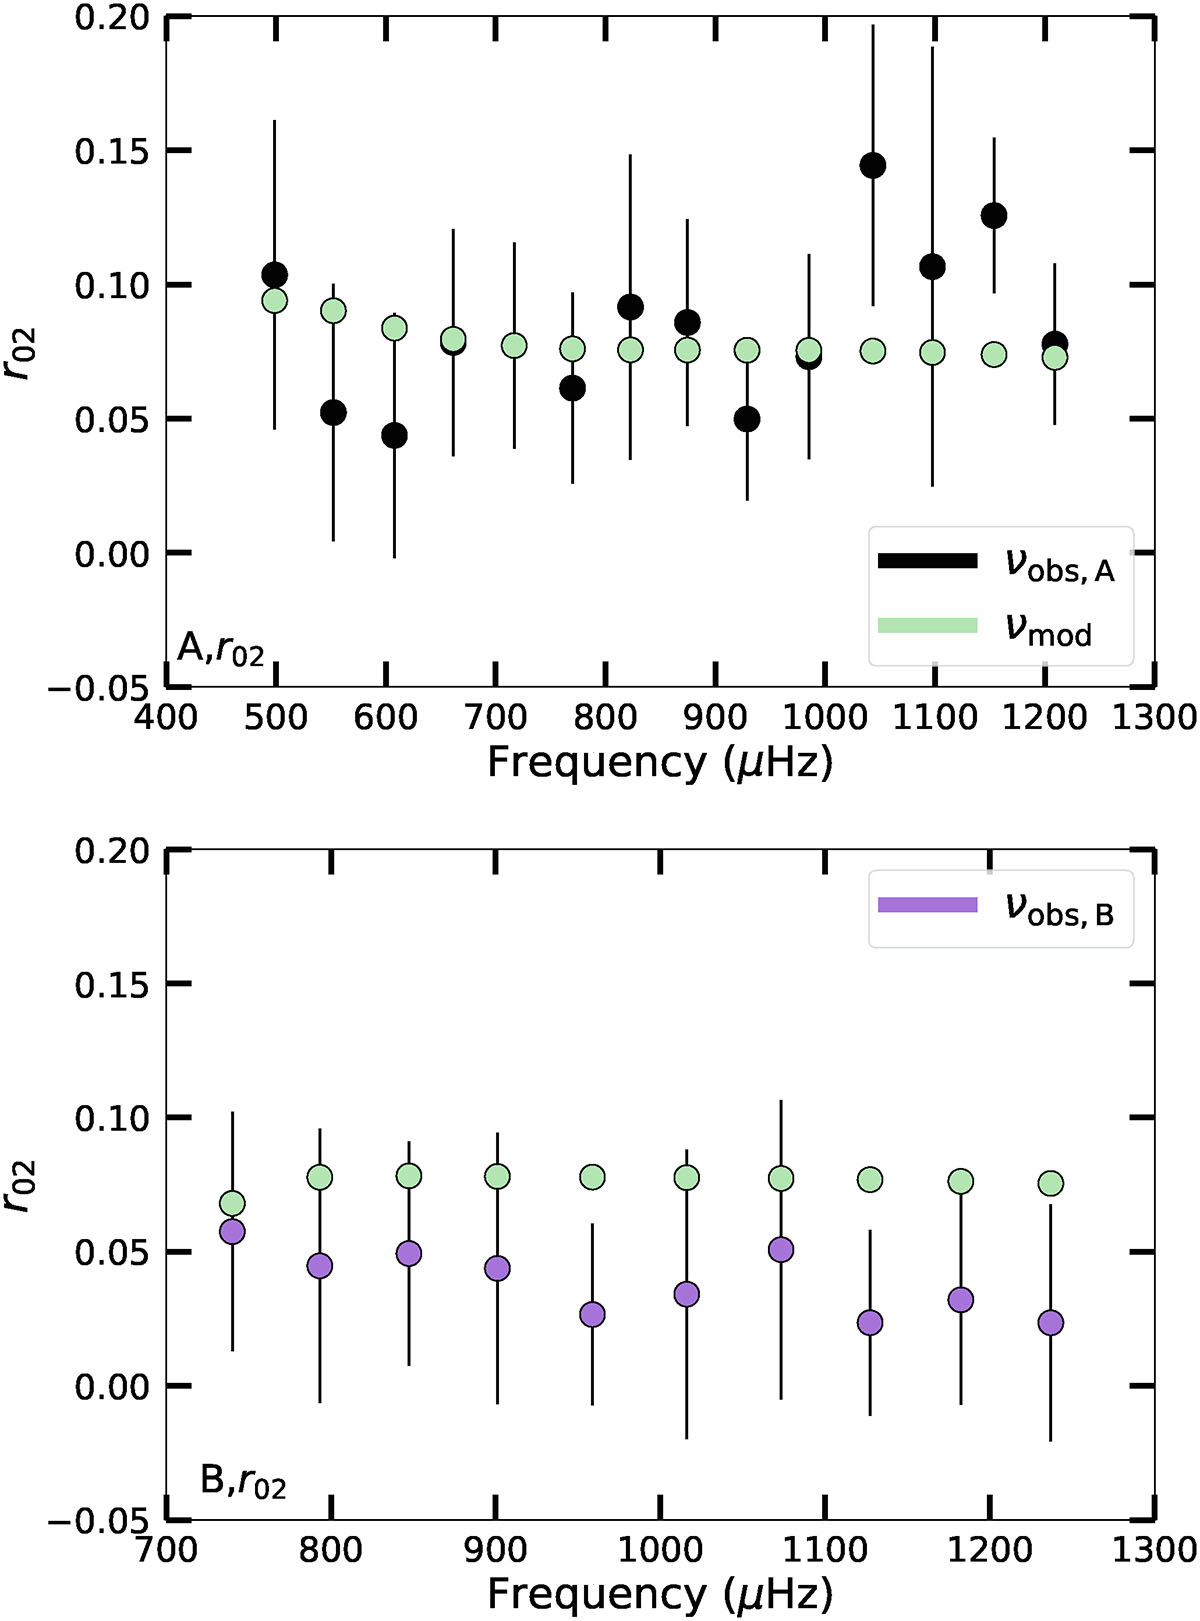
Ratios r02 from test 2 for scenario A (top panel) and scenario B (bottom panel). The black points with error bars are computed from the observed frequencies and the green points correspond to the best-fit model.
Current usage metrics show cumulative count of Article Views (full-text article views including HTML views, PDF and ePub downloads, according to the available data) and Abstracts Views on Vision4Press platform.
Data correspond to usage on the plateform after 2015. The current usage metrics is available 48-96 hours after online publication and is updated daily on week days.
Initial download of the metrics may take a while.