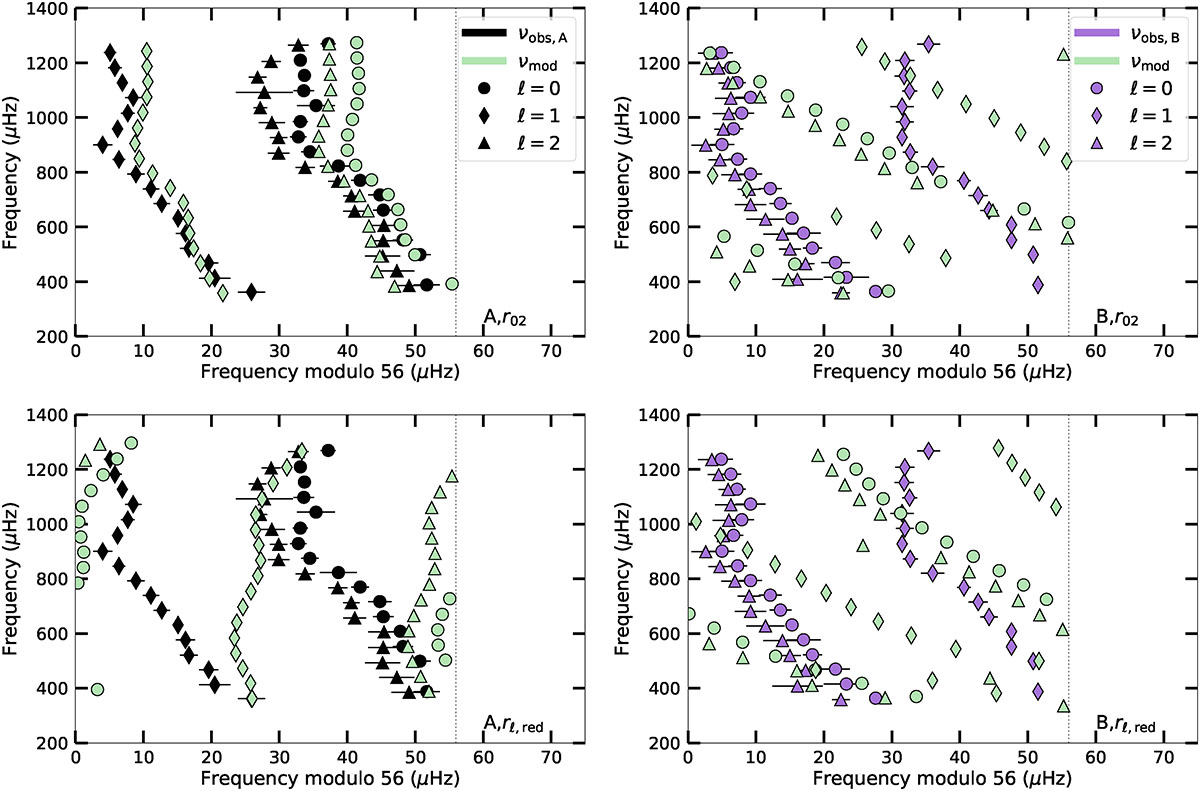
Fig. 6.
Download original image
Échelle diagram of the frequencies of the best models from test 2 (top row) and 3 (bottom row) including the ratios. The left columns show frequencies from scenario A, while the right columns show frequencies from scenario B. Circles represent modes ℓ = 0, triangles represent modes ℓ = 1, and diamonds represent modes with ℓ = 2. The black symbols with error bars indicate the observed frequencies and green symbols represent the model frequencies. The dotted gray line indicates the 56 μHZ frequency.
Current usage metrics show cumulative count of Article Views (full-text article views including HTML views, PDF and ePub downloads, according to the available data) and Abstracts Views on Vision4Press platform.
Data correspond to usage on the plateform after 2015. The current usage metrics is available 48-96 hours after online publication and is updated daily on week days.
Initial download of the metrics may take a while.