Fig. 8.
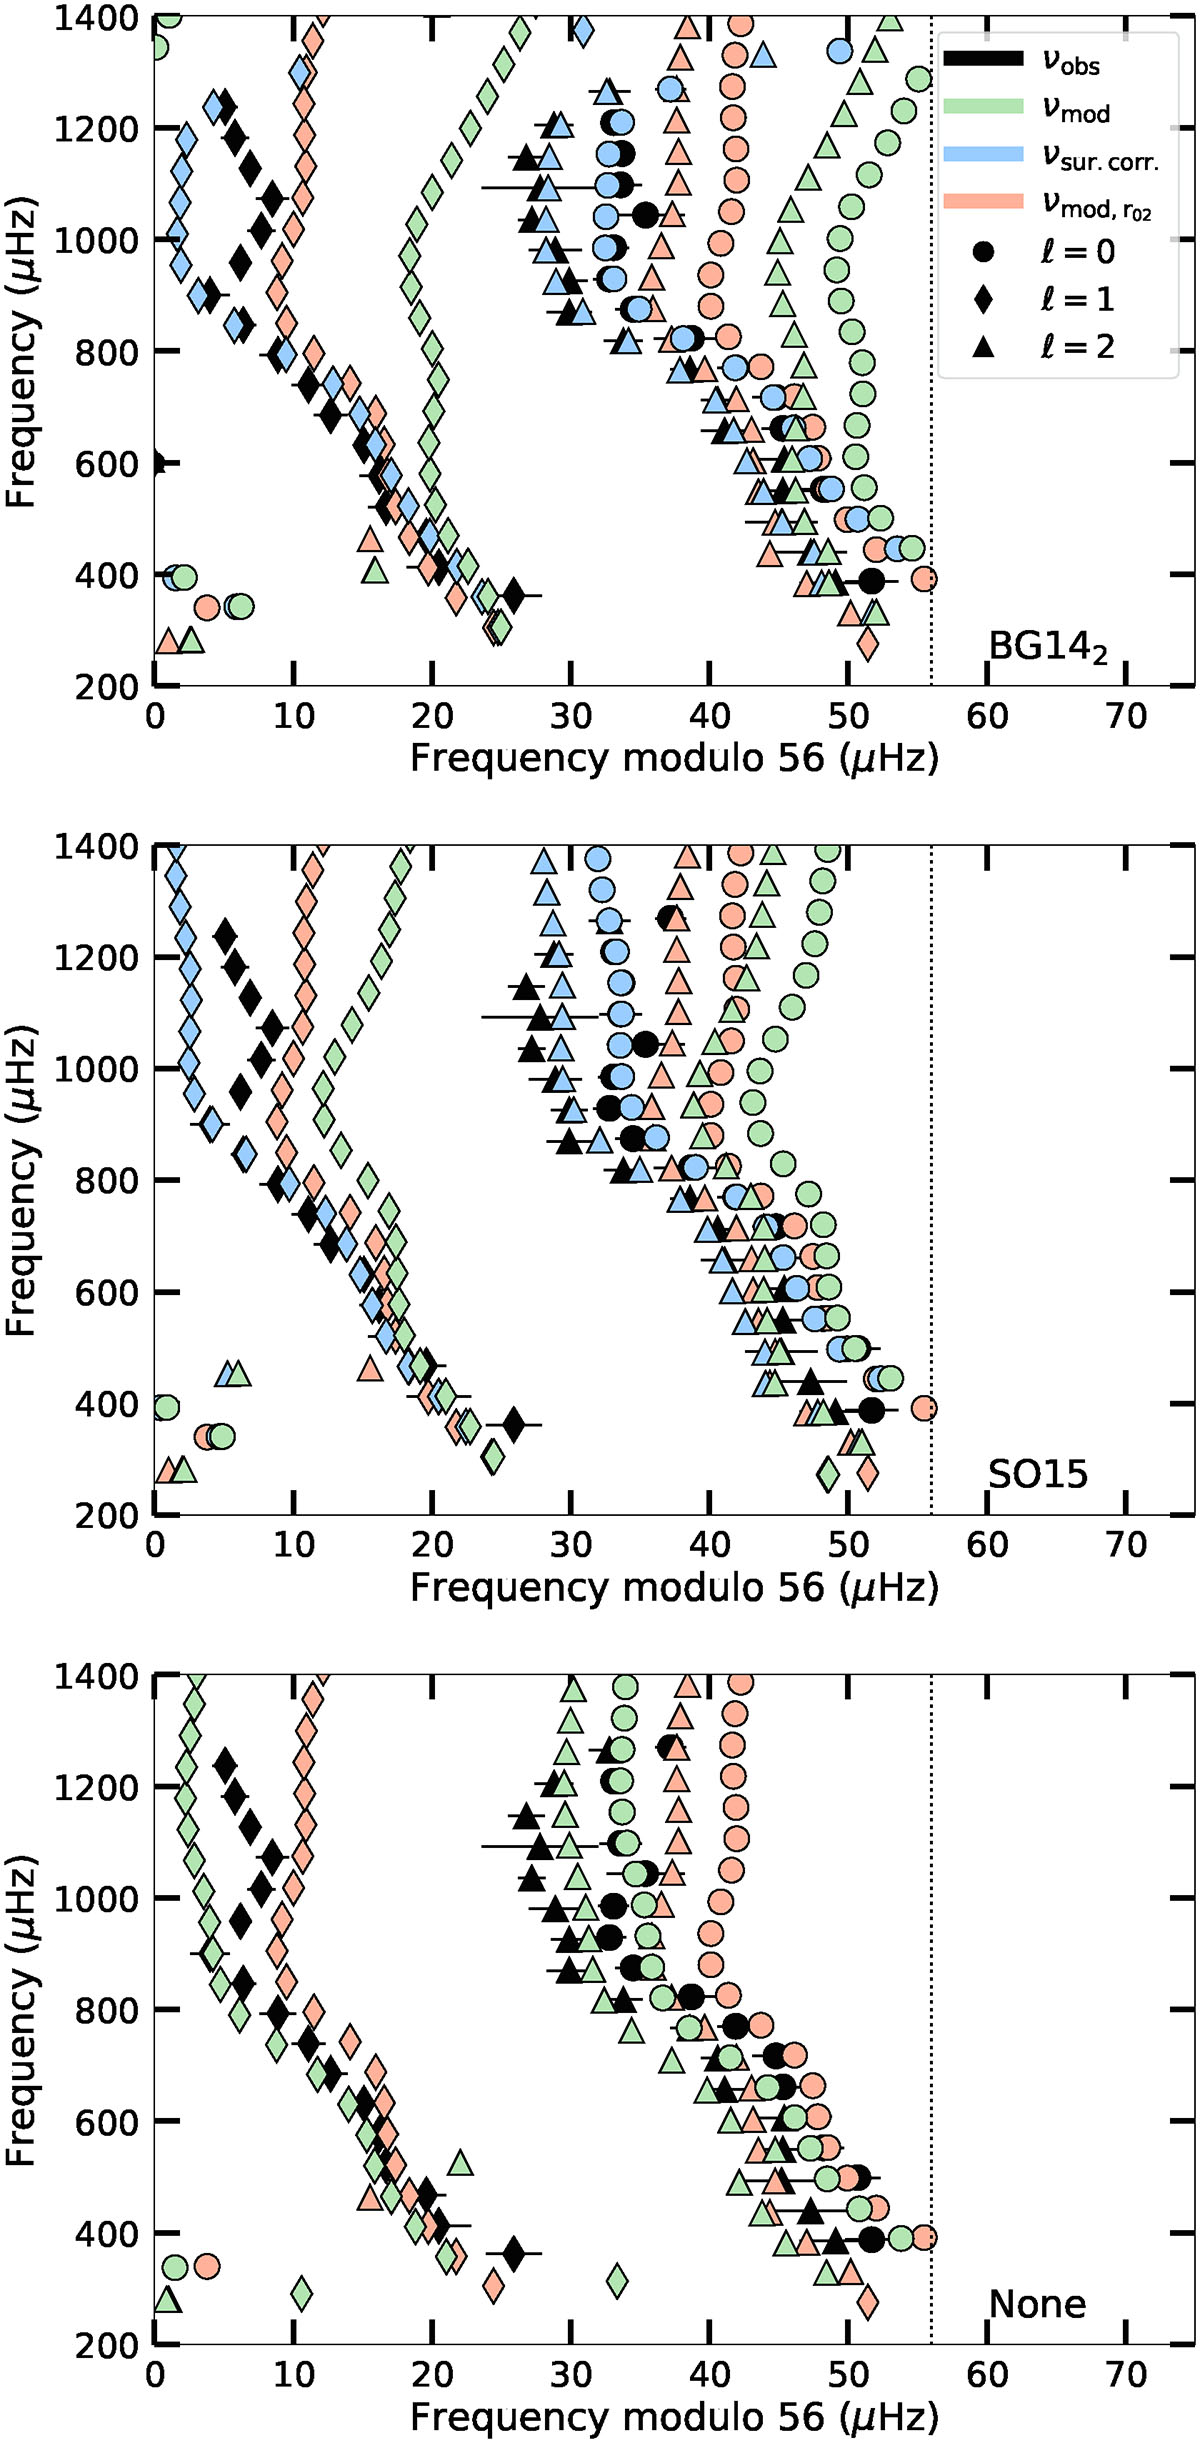
Download original image
Échelle diagram of the frequencies of the models resulting from the optimization procedure. The top panel shows the best model with the BG142 correction, the middle panel with the SO15 correction, and the bottom panel with no surface correction. Black symbols with error bars indicate the observed frequencies, green symbols represent the model frequencies without corrections, blue symbols represent the model frequencies with surface corrections, and the orange symbols represent the frequencies of the model constrained using ratios. Circles represent modes ℓ = 0, triangles represent modes with ℓ = 1, and diamonds represent modes ℓ = 2. The dotted gray line indicates the 56 μHZ frequency.
Current usage metrics show cumulative count of Article Views (full-text article views including HTML views, PDF and ePub downloads, according to the available data) and Abstracts Views on Vision4Press platform.
Data correspond to usage on the plateform after 2015. The current usage metrics is available 48-96 hours after online publication and is updated daily on week days.
Initial download of the metrics may take a while.