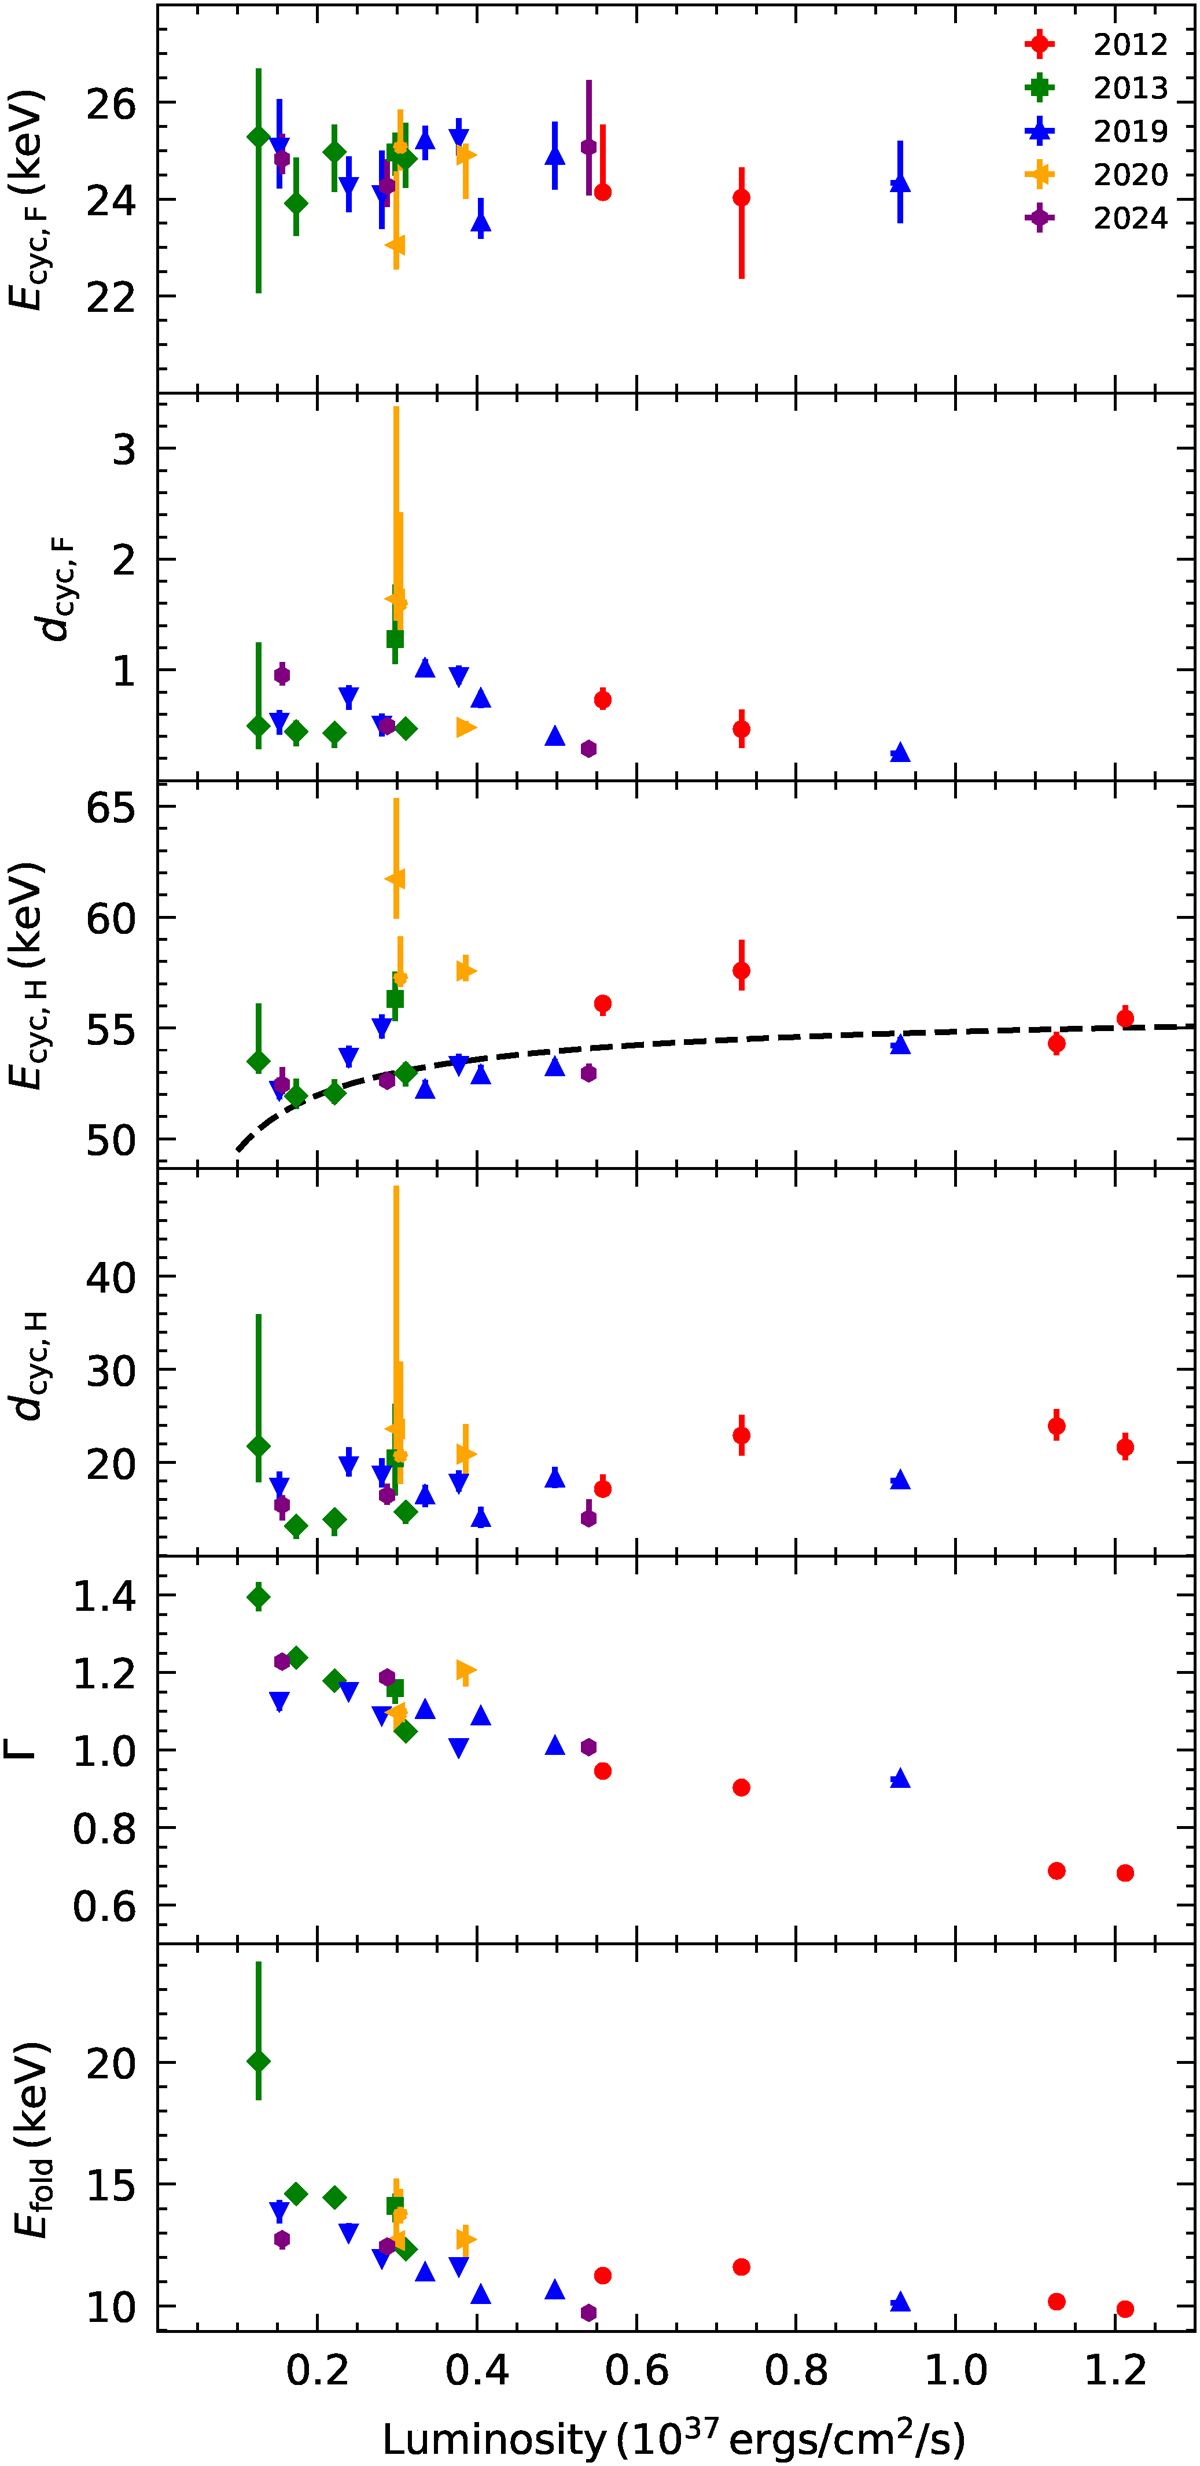
Fig. 5.
Download original image
Flux-resolved spectral parameters derived from the pulse-to-pulse analysis in the 3–70 keV energy range. Different colors represent different observation years, and distinct marker styles indicate observation IDs; time-averaged results for the short-exposure observations (30002007002, 90602328002, 90602328004, and 90602328006) are also shown. The dashed line in the second panel is the theoretical prediction for E* = 28.097 ± 0.052 keV (see Equation (4)).
Current usage metrics show cumulative count of Article Views (full-text article views including HTML views, PDF and ePub downloads, according to the available data) and Abstracts Views on Vision4Press platform.
Data correspond to usage on the plateform after 2015. The current usage metrics is available 48-96 hours after online publication and is updated daily on week days.
Initial download of the metrics may take a while.