Fig. 2
Download original image
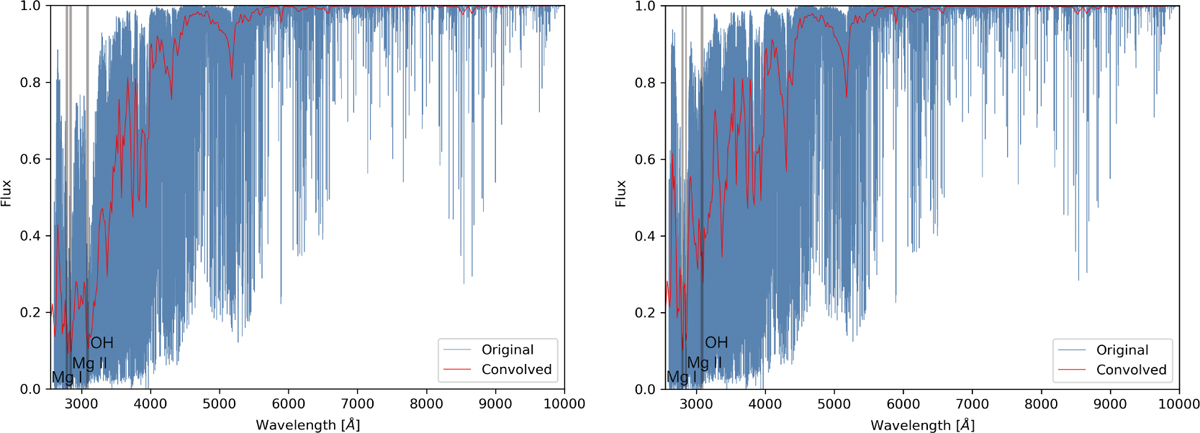
Comparison between the original high resolution spectra (blue) and the low-resolution spectra (red) degraded to R ≈ 200 through Gaussian convolution. Both panels cover the 2550−10 000 Å range, with the left panel showing an MP star with [O/Fe]=0.4, [Mg/Fe]=0.0, Teff=4700 K, log g=5.0, and [Fe/H]=−2.0, and the right panel showing an MP star with [O/Fe]=0.0, [Mg/Fe]=0.4, and the same other parameters.
Current usage metrics show cumulative count of Article Views (full-text article views including HTML views, PDF and ePub downloads, according to the available data) and Abstracts Views on Vision4Press platform.
Data correspond to usage on the plateform after 2015. The current usage metrics is available 48-96 hours after online publication and is updated daily on week days.
Initial download of the metrics may take a while.