Fig. 3
Download original image
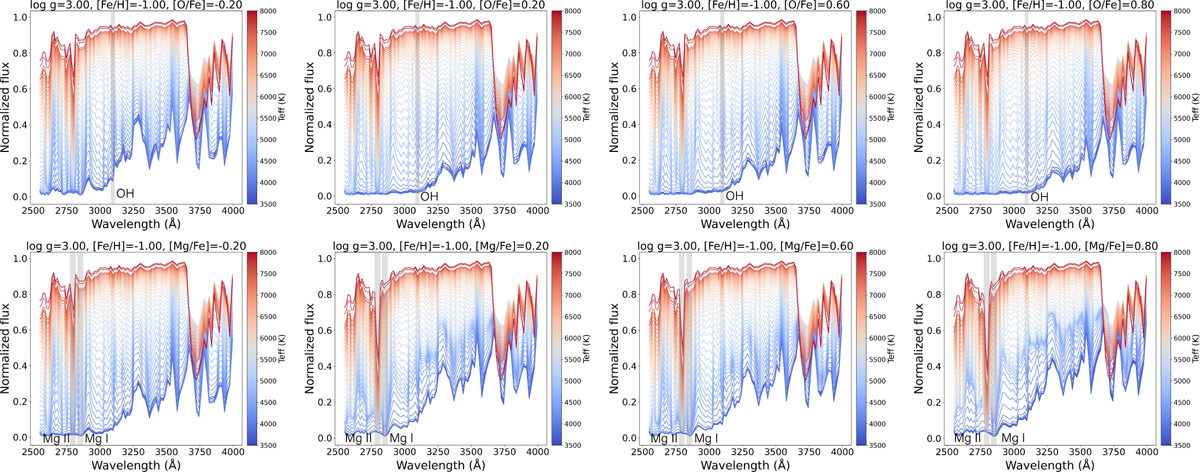
Variation of UV spectral flux as a function of Teff with fixed parameters (log g=3.0,[Fe/H]=−1.0). Upper row: variation for the [O/Fe] ratio of −0.2,+0.2,+0.6, and +0.8. Lower row: same as the upper row but for [Mg/Fe] ratios. The depth of the OH molecular band first increases and then decreases with rising Teff, with the peak occurring around K-type stars (approximately 4000−5000 K). Similarly, the depth of the Mg I line increases and then decreases with rising Teff, with the peak occurring around K-type to G-type stars (approximately 4000−5800 K), while the Mg II line continuously strengthens with increasing Teff.
Current usage metrics show cumulative count of Article Views (full-text article views including HTML views, PDF and ePub downloads, according to the available data) and Abstracts Views on Vision4Press platform.
Data correspond to usage on the plateform after 2015. The current usage metrics is available 48-96 hours after online publication and is updated daily on week days.
Initial download of the metrics may take a while.