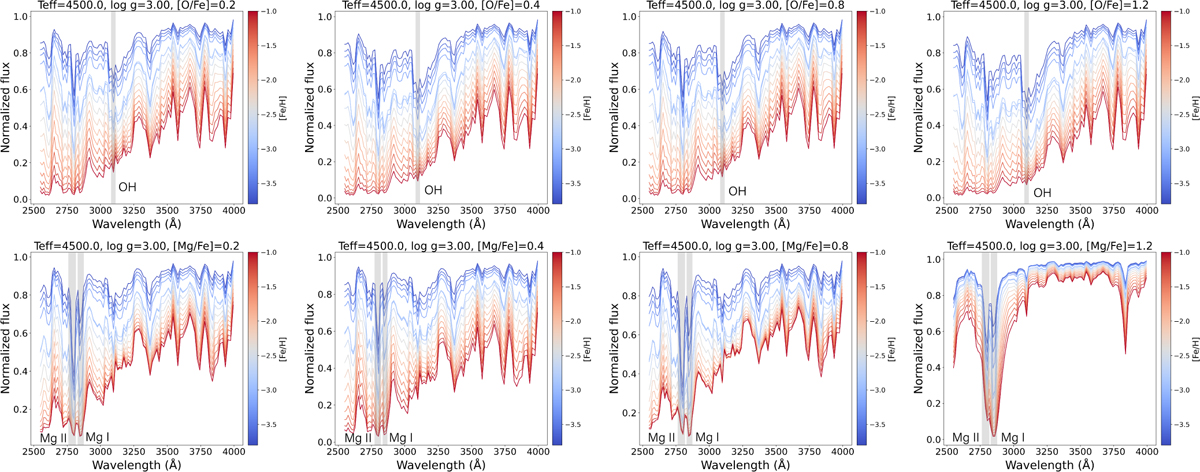
Fig. 5
Download original image
Similar to Figures 3 and 4, but showing the variation of UV spectral flux as a function of [Fe/H]. The synthetic spectra were calculated for fixed parameters (Teff=4500 K, log g=3.0). Upper row: variation for the [O/Fe] ratios of +0.2,+0.4,+0.8, and +1.2. Lower row: same as the upper row but for [Mg/Fe] ratios. As [Fe/H] decreases, the strength of the OH molecular band, Mg II doublet, and Mg I line gradually increases, with the Mg II doublet showing a more significant increase. When [Fe/H]<−2.8, the strength of the Mg II doublet surpasses that of the Mg I line, and as [Fe/H] decreases further, the strength difference between the two increases.
Current usage metrics show cumulative count of Article Views (full-text article views including HTML views, PDF and ePub downloads, according to the available data) and Abstracts Views on Vision4Press platform.
Data correspond to usage on the plateform after 2015. The current usage metrics is available 48-96 hours after online publication and is updated daily on week days.
Initial download of the metrics may take a while.