Open Access
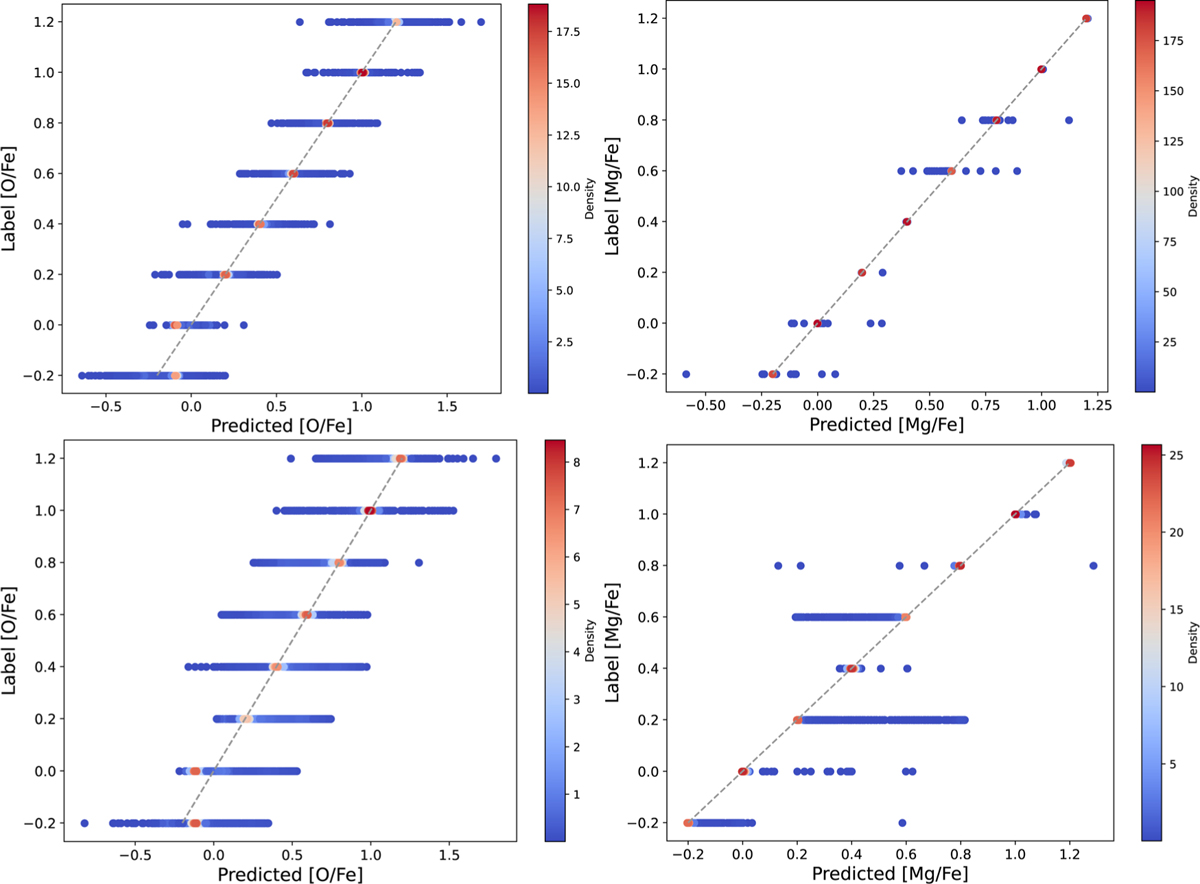
Fig. 7
Download original image
Predicted versus true [O/Fe] (left) and [Mg/Fe] (right) on the test set. Upper row: model trained on 2550−10 000 Å spectra. Lower row: model trained on 4000–10 000 Å spectra. Colors encode the local point density; the dashed line marks the 1:1 relation.
Current usage metrics show cumulative count of Article Views (full-text article views including HTML views, PDF and ePub downloads, according to the available data) and Abstracts Views on Vision4Press platform.
Data correspond to usage on the plateform after 2015. The current usage metrics is available 48-96 hours after online publication and is updated daily on week days.
Initial download of the metrics may take a while.