Fig. B.1
Download original image
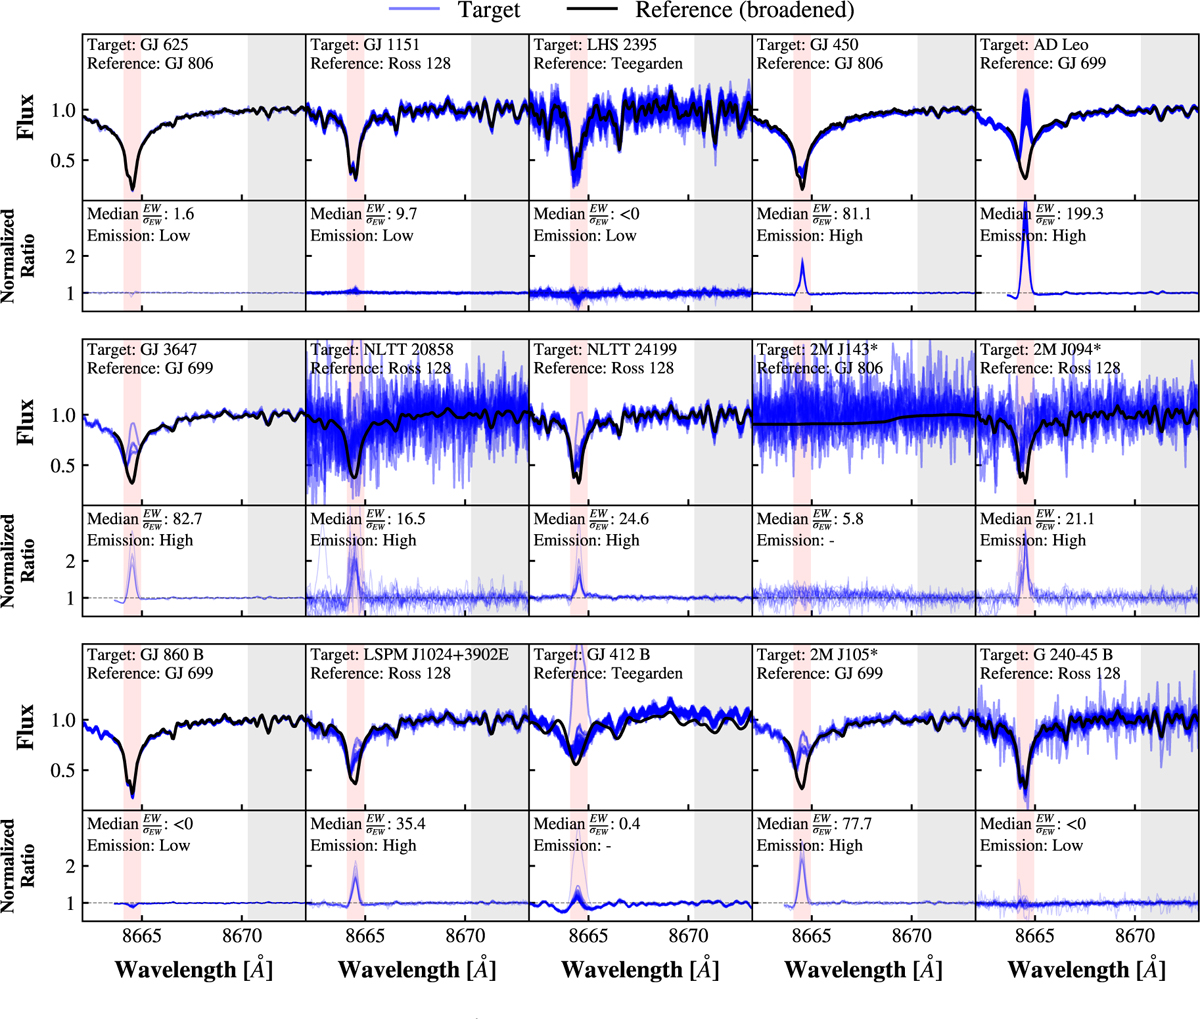
HPF observations of the Ca II IRT line at 8664 Å for all non-SB2 targets in the M dwarf radio sample (blue curves), compared to a single high S/N as-observed HPF spectrum of slowly rotating quiescent reference stars (black). The reference spectrum is rotationally broadened to match the observed broadening of the lines, by using the estimates of the v sin i obtained by HPF-SpecMatch. The red shaded region marks the line center, which is the emission window used to compute the Equivalent Width. The lower panels show the normalized ratio residuals (target/reference), highlighting any excess emission as a peak in the residuals. A continuum region (8670.300–8673.190 Å, gray shaded) is used to normalize the residuals to unity. The lower panels also denote our overall Ca II IRT emission designation, as either ‘Low’ ![]() , or ‘High’
, or ‘High’ ![]() . We do not give an emission designation to targets 2MASS J143 and GJ 412, as the observations do not match well to their respective reference spectra, making it unadvisable to interpret the obtained
. We do not give an emission designation to targets 2MASS J143 and GJ 412, as the observations do not match well to their respective reference spectra, making it unadvisable to interpret the obtained ![]() value.
value.
Current usage metrics show cumulative count of Article Views (full-text article views including HTML views, PDF and ePub downloads, according to the available data) and Abstracts Views on Vision4Press platform.
Data correspond to usage on the plateform after 2015. The current usage metrics is available 48-96 hours after online publication and is updated daily on week days.
Initial download of the metrics may take a while.