Open Access
Fig. C.1
Download original image
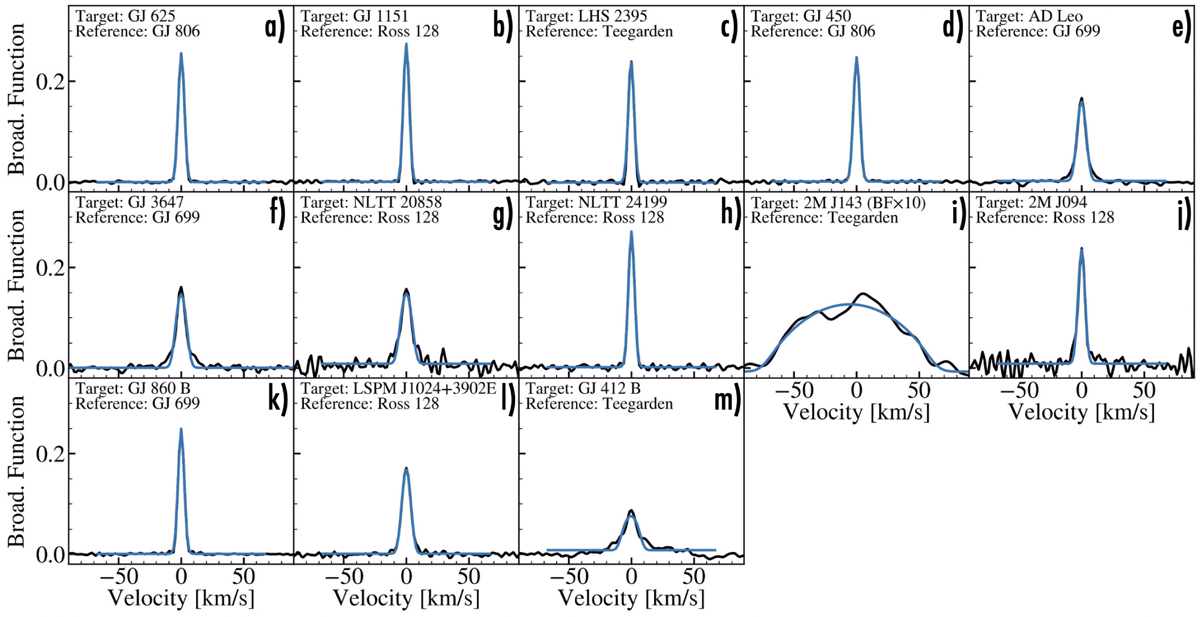
Broadening functions for the single-lined systems. The black curves show the broadening function from the highest S/N HPF spectrum. The blue curve shows a rotationally broadened line profile accounting for the resolution of HPF of 55,000, using the best-fit v sin i⋆ listed in Table 1.
Current usage metrics show cumulative count of Article Views (full-text article views including HTML views, PDF and ePub downloads, according to the available data) and Abstracts Views on Vision4Press platform.
Data correspond to usage on the plateform after 2015. The current usage metrics is available 48-96 hours after online publication and is updated daily on week days.
Initial download of the metrics may take a while.