Fig. D.1
Download original image
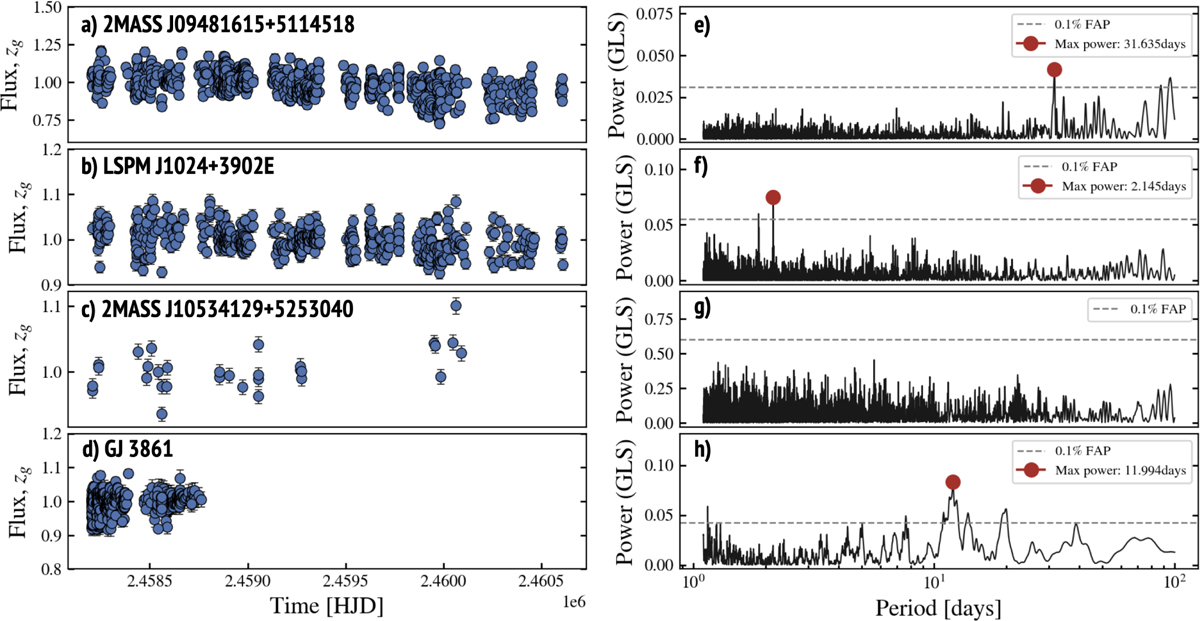
ZTF zg-band photometry of a) 2MASS J09481615+5114518, b) LSPM J1024+3902E, c) 2MASS J10534129+5253040, and d) GJ 3861. Panels e), f), g) and h) show the corresponding Lomb–Scargle periodograms. The gray vertical dashed lines show the 0.1% false alarm probability, and the red dots highlight the highest peaks with false alarms lower than 0.1% probability.
Current usage metrics show cumulative count of Article Views (full-text article views including HTML views, PDF and ePub downloads, according to the available data) and Abstracts Views on Vision4Press platform.
Data correspond to usage on the plateform after 2015. The current usage metrics is available 48-96 hours after online publication and is updated daily on week days.
Initial download of the metrics may take a while.