Fig. 4
Download original image
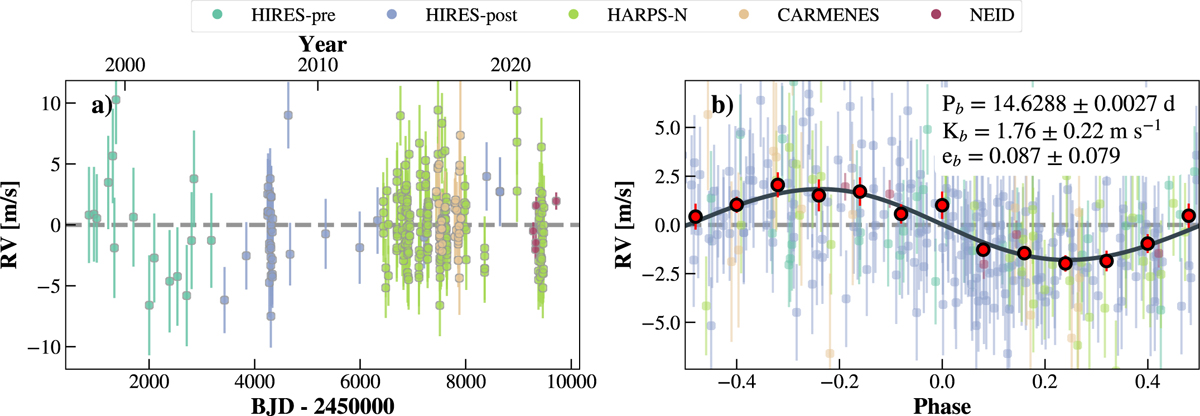
RV observations of GJ 625. (A) RV time series of all available data of GJ 625, color-coded by spectrograph. (B) Phase folded RV data of GJ 625 phase-folded on the best-fit period of our model of 14.6288 days. The color coding is the same as in the plot on the left. Binned RV points are overplotted in red. The best-fit Keplerian model is shown in black.
Current usage metrics show cumulative count of Article Views (full-text article views including HTML views, PDF and ePub downloads, according to the available data) and Abstracts Views on Vision4Press platform.
Data correspond to usage on the plateform after 2015. The current usage metrics is available 48-96 hours after online publication and is updated daily on week days.
Initial download of the metrics may take a while.