Open Access
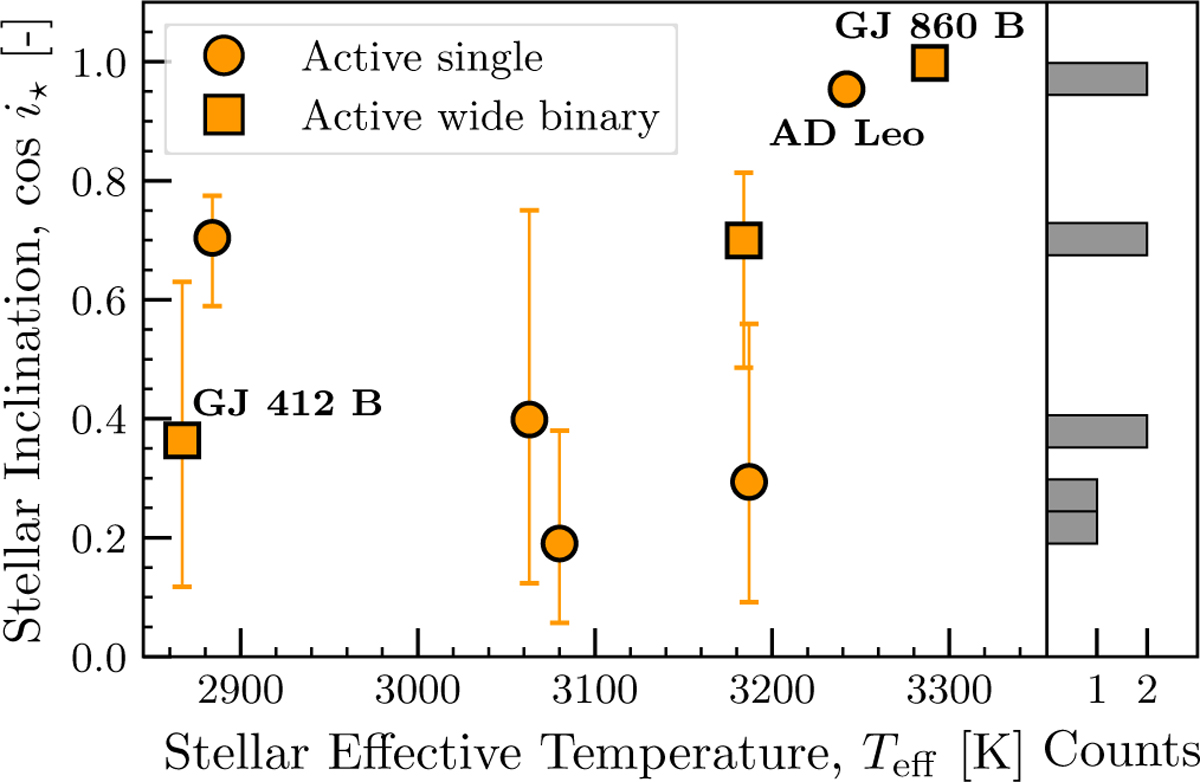
Fig. 7
Download original image
Stellar inclinations (cos i⋆) of the subsample where we have v sin i⋆, R⋆, and Prot measurements. Left shows the cos i⋆ over the stellar effective temperature. Right shows a histogram of the cos i⋆ values. The distribution of stellar inclinations is indistinguishable from an isotropic distribution.
Current usage metrics show cumulative count of Article Views (full-text article views including HTML views, PDF and ePub downloads, according to the available data) and Abstracts Views on Vision4Press platform.
Data correspond to usage on the plateform after 2015. The current usage metrics is available 48-96 hours after online publication and is updated daily on week days.
Initial download of the metrics may take a while.