Open Access
Fig. B.1
Download original image
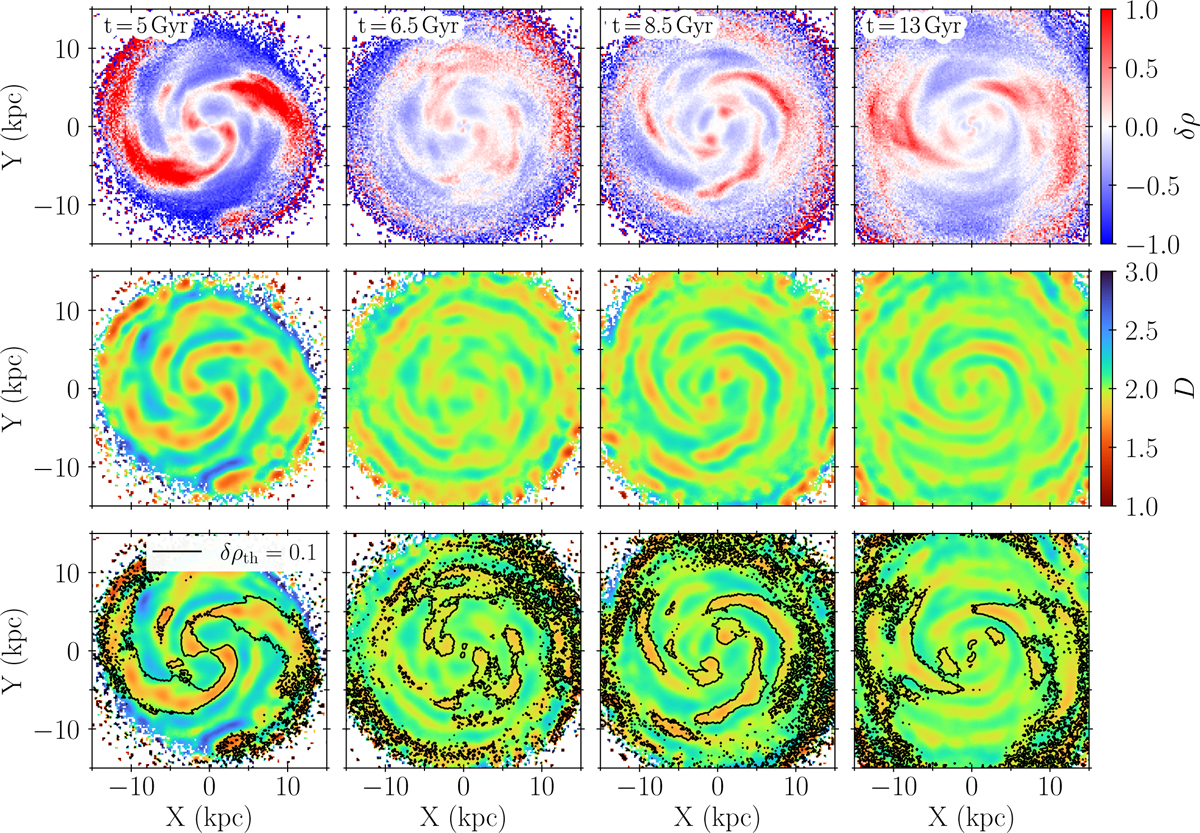
Comparison between the radially normalised density, δρ, (top) and the local dimension, D, (middle) considering all stars. Columns show the times 5, 6.5, 8.5, and 13 Gyr from left to right. Bottom row: Same as the middle one but with the contour of δρ = 0.1 overplotted. The rotation is anti-clockwise.
Current usage metrics show cumulative count of Article Views (full-text article views including HTML views, PDF and ePub downloads, according to the available data) and Abstracts Views on Vision4Press platform.
Data correspond to usage on the plateform after 2015. The current usage metrics is available 48-96 hours after online publication and is updated daily on week days.
Initial download of the metrics may take a while.