Open Access
Fig. 2
Download original image
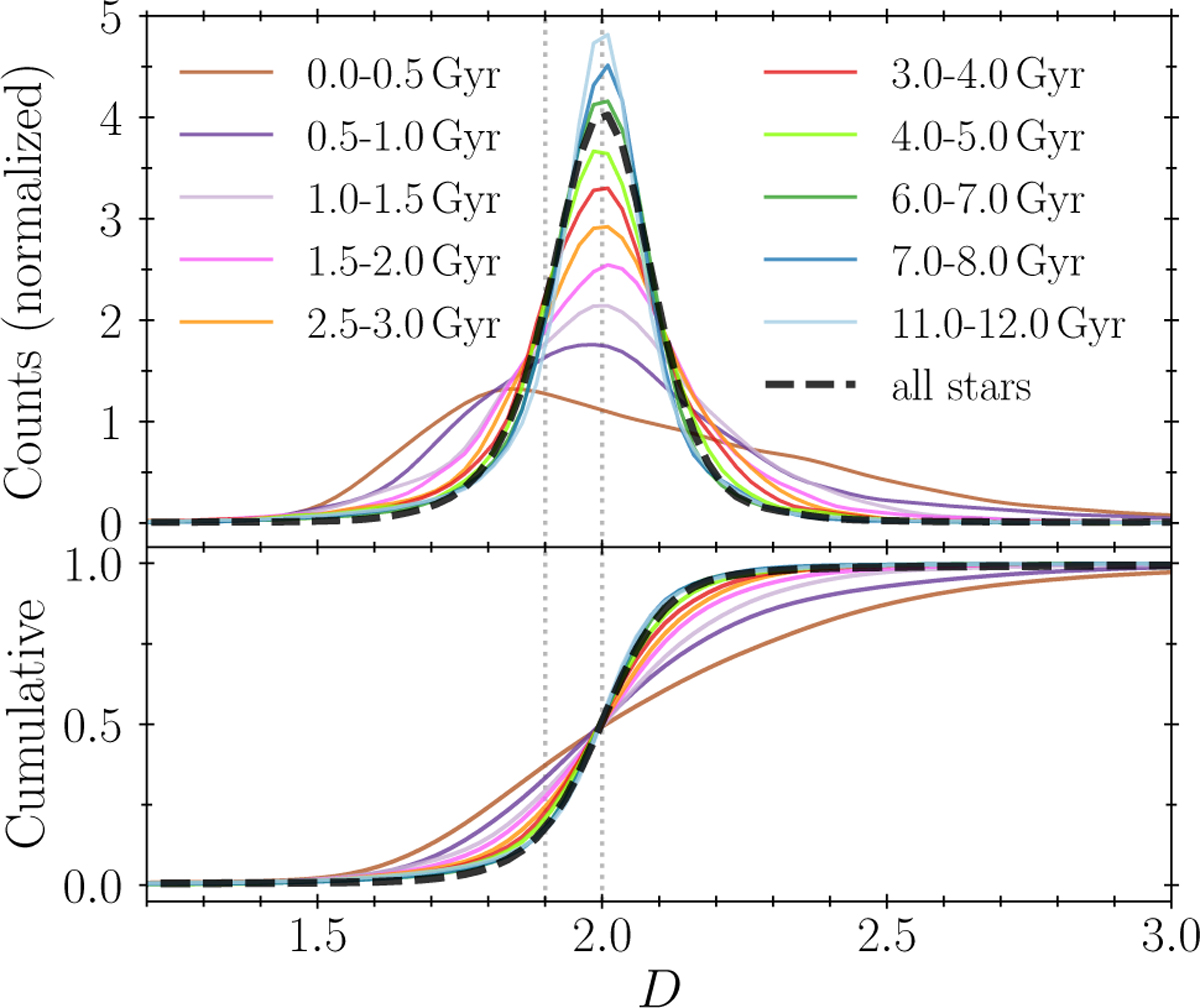
Normalised (top) and cumulative distributions (bottom) of local dimension values from all stars (dashed black curve) and from different stellar populations (solid curves) at 13 Gyr. Grid points at radius smaller than 4 kpc are excluded. Grey dotted vertical lines indicate the reference values D = 1.9 and D = 2.
Current usage metrics show cumulative count of Article Views (full-text article views including HTML views, PDF and ePub downloads, according to the available data) and Abstracts Views on Vision4Press platform.
Data correspond to usage on the plateform after 2015. The current usage metrics is available 48-96 hours after online publication and is updated daily on week days.
Initial download of the metrics may take a while.