Fig. 3
Download original image
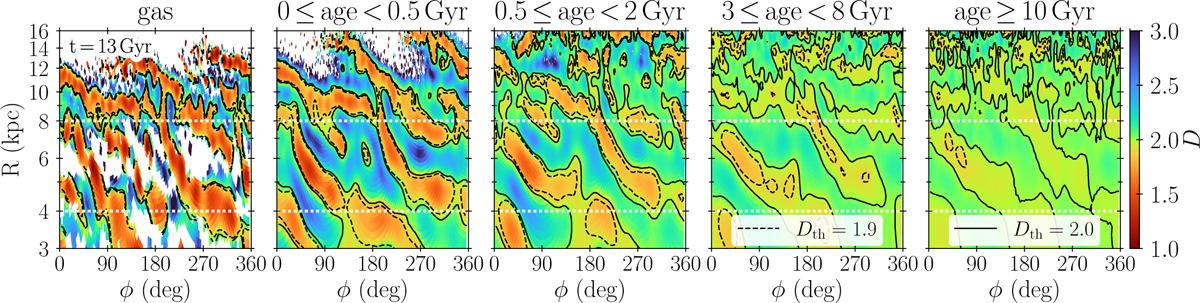
Local dimension maps in log-polar coordinates for gas (leftmost panel) and stars of different ages (younger than 0.5 Gyr, 0.5–2 Gyr old, 3–8 Gyr old, and older than 10 Gyr, from left to right) at time 13 Gyr. The azimuth increases in the direction of rotation. Contours of D = 1.9 (dashed) and D = 2 (solid) are overplotted. Radii 4 and 8 kpc are indicated with dotted white lines.
Current usage metrics show cumulative count of Article Views (full-text article views including HTML views, PDF and ePub downloads, according to the available data) and Abstracts Views on Vision4Press platform.
Data correspond to usage on the plateform after 2015. The current usage metrics is available 48-96 hours after online publication and is updated daily on week days.
Initial download of the metrics may take a while.