Fig. 4
Download original image
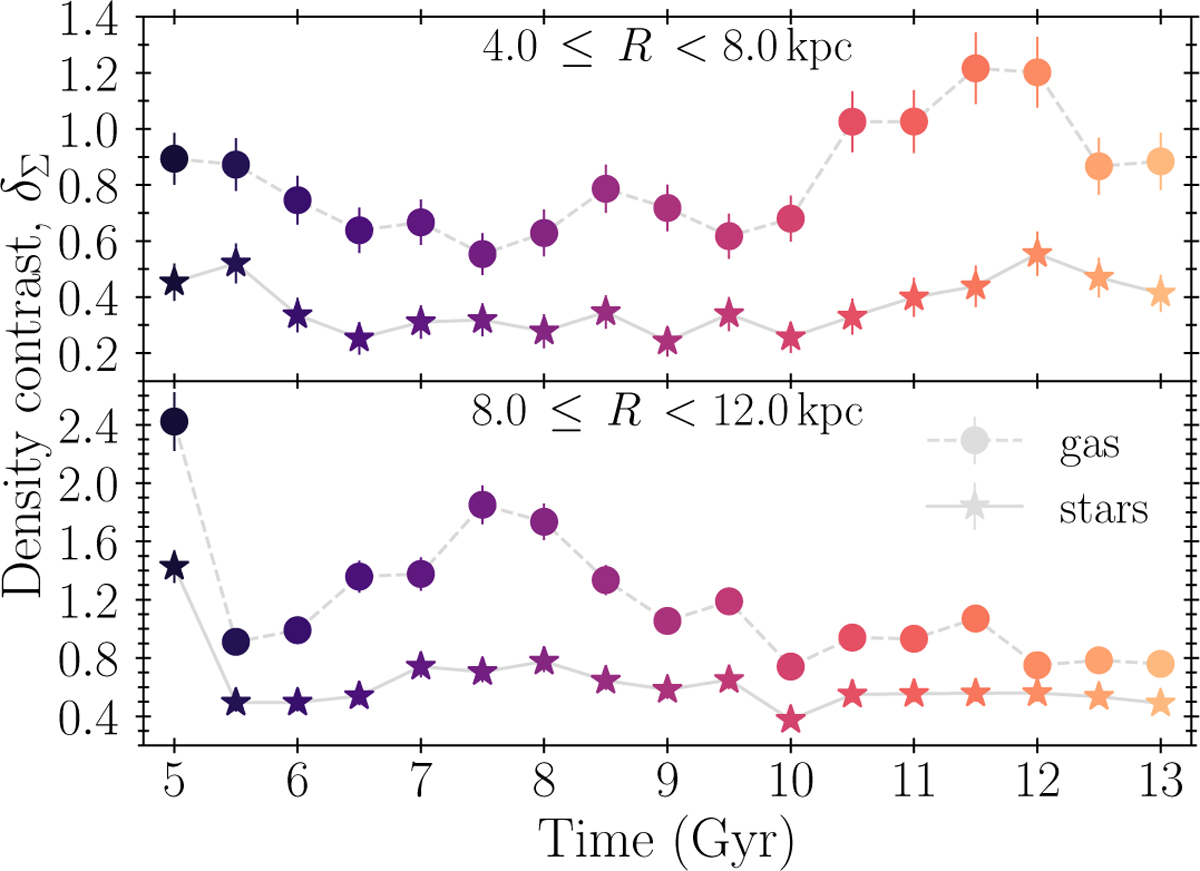
Time evolution of the spiral arms density contrast. We considered the radial ranges 4–8 kpc (top) and 8–12 kpc (bottom). The points show the relative ratio between the mean mass surface density of the arms and the disc average mass surface density of gas (circles) and of all stellar populations together (stars) as a function of time. Colour changes with time as in Figs. 5, 6, and 11.
Current usage metrics show cumulative count of Article Views (full-text article views including HTML views, PDF and ePub downloads, according to the available data) and Abstracts Views on Vision4Press platform.
Data correspond to usage on the plateform after 2015. The current usage metrics is available 48-96 hours after online publication and is updated daily on week days.
Initial download of the metrics may take a while.