Fig. 5
Download original image
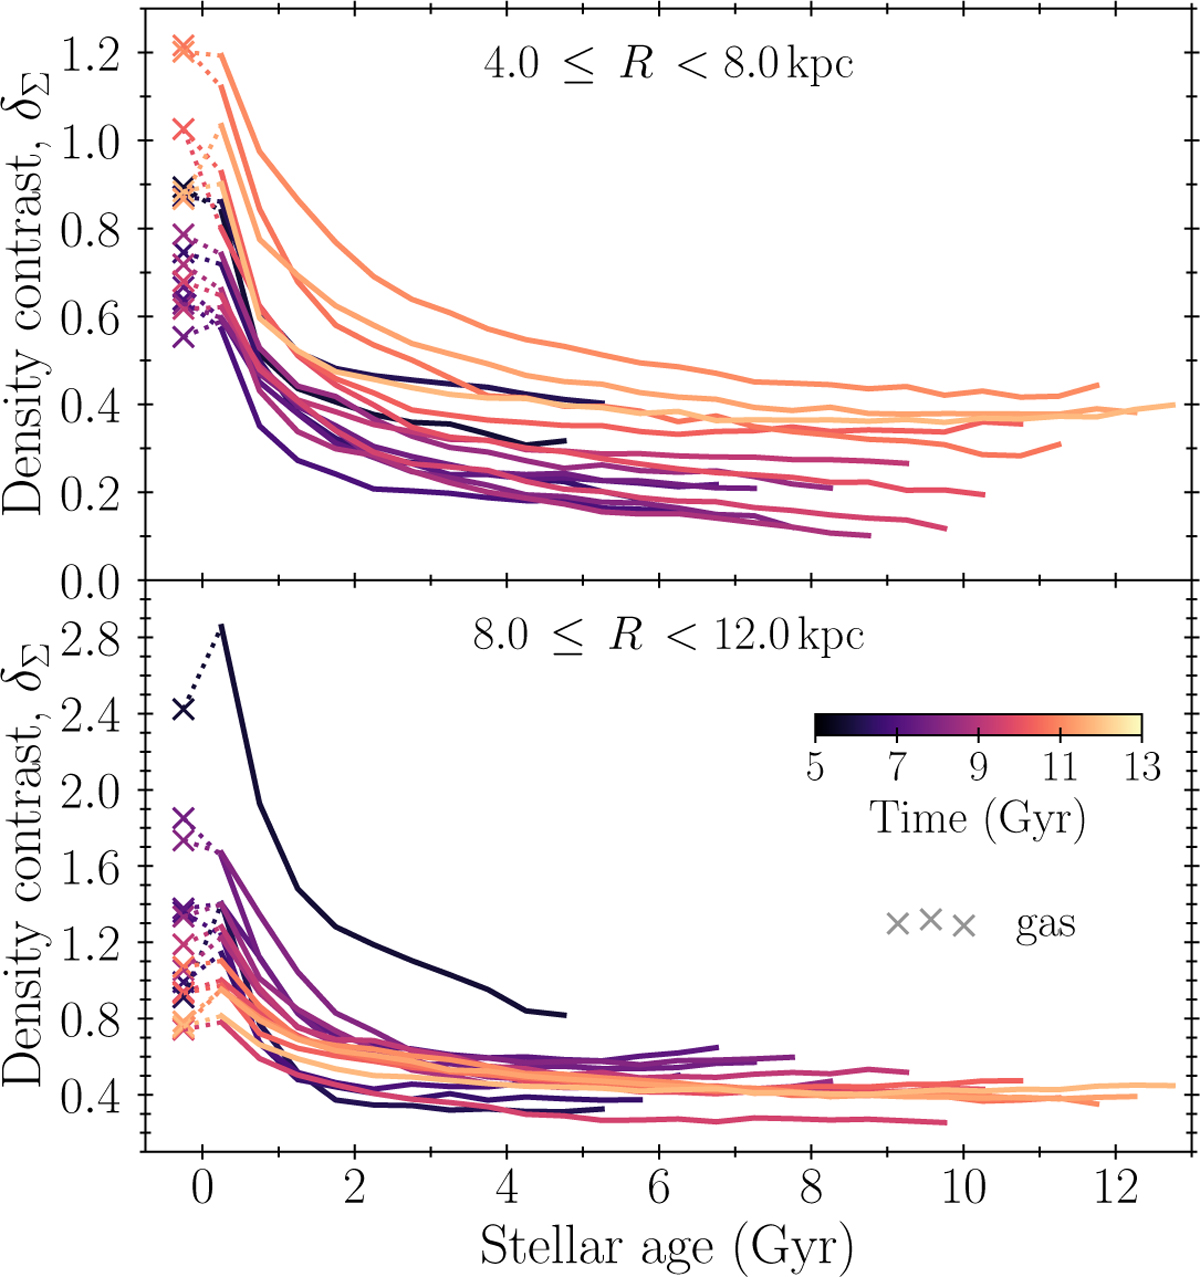
Density contrast of spiral arms for different populations and times. Two radial ranges are considered: 4–8 kpc (top) and 8–12 kpc (bottom). The lines show the relative ratio between the mean mass surface density of the arms and the disc average mass surface density as a function of stellar age. Each line corresponds to a different time in the simulation (with darker colours meaning earlier times, as in Fig. 4). Crosses linked with dotted lines to guide the eye correspond to the gas density contrast at the corresponding time.
Current usage metrics show cumulative count of Article Views (full-text article views including HTML views, PDF and ePub downloads, according to the available data) and Abstracts Views on Vision4Press platform.
Data correspond to usage on the plateform after 2015. The current usage metrics is available 48-96 hours after online publication and is updated daily on week days.
Initial download of the metrics may take a while.