Fig. 7
Download original image
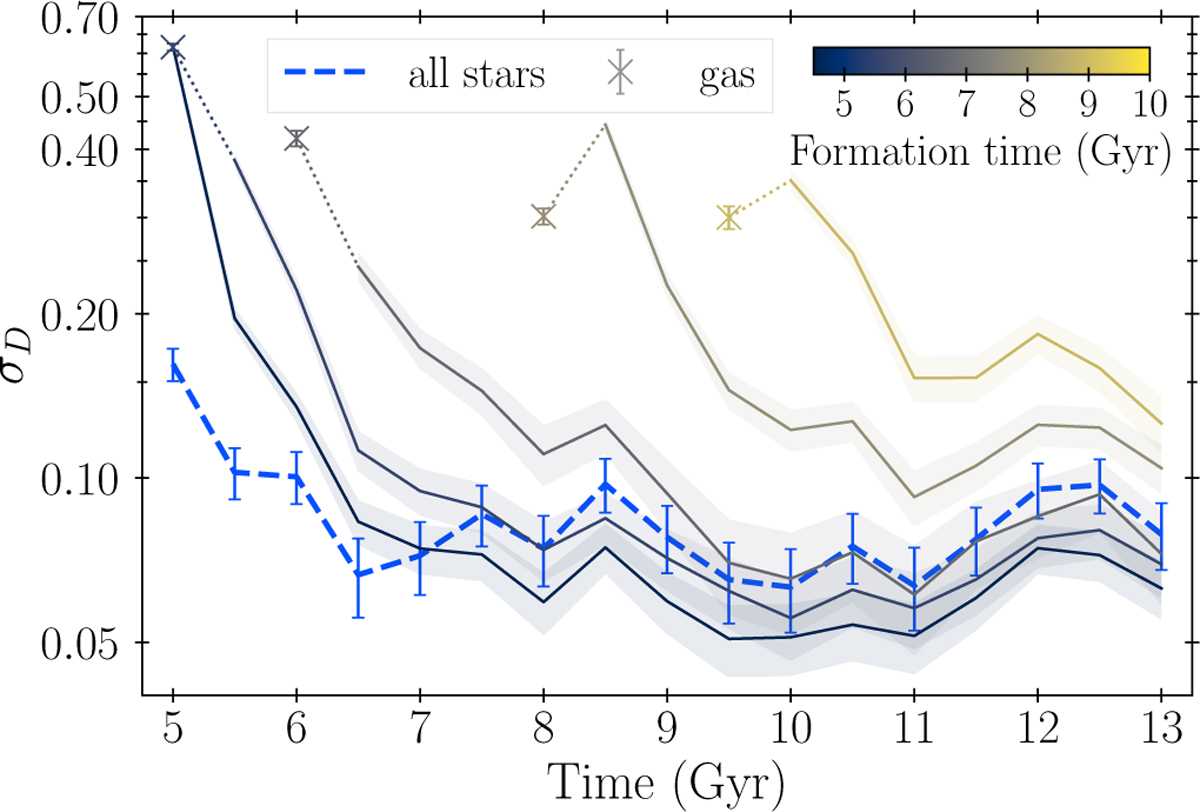
Temporal evolution of the standard deviation of D, σD, for several co-forming groups of stars traced along snapshots (solid lines) and for all stars together (dashed line). Crosses correspond to the gas of the snapshot 0.5 Gyr before the formation of each group and are linked to the curves with dotted lines to guide the eye. Shaded areas show the dispersion for each formation time due to short-term fluctuations, computed as the mean standard deviation of σD from intervals with higher-cadence. The innermost 4 kpc and radii beyond 8 kpc are excluded.
Current usage metrics show cumulative count of Article Views (full-text article views including HTML views, PDF and ePub downloads, according to the available data) and Abstracts Views on Vision4Press platform.
Data correspond to usage on the plateform after 2015. The current usage metrics is available 48-96 hours after online publication and is updated daily on week days.
Initial download of the metrics may take a while.