Fig. 1.
Download original image
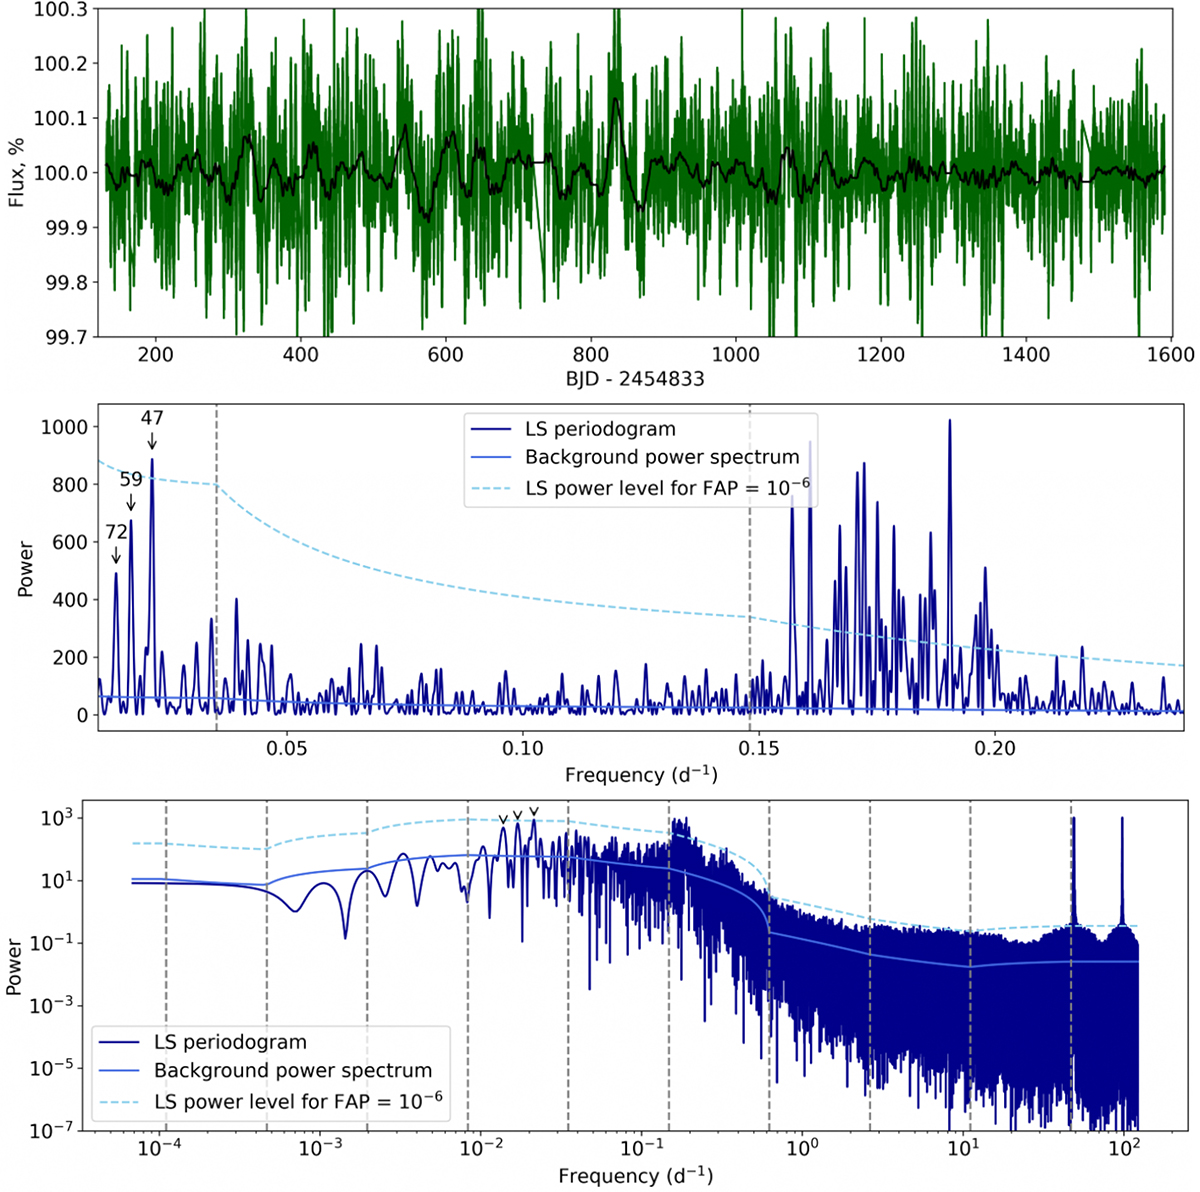
Upper panel: Light curve of KIC 6876668. The solid black line corresponds to the 20-d moving average. Medium and bottom panels: LS analysis of the light curve for the whole frequency range (medium panel) and for the period range [30 d, 90 d] (bottom panel). Black arrows indicate the possible peaks of short-term cycles (with corresponding periods in days). The broad peaks around 0.18−0.2 d−1 show the rotation period of the star. The solid and dashed light blue lines give the background power level and the 10−6 FAP level, respectively. The vertical grey lines mark the separation between the frequency bins used to the determine the background power spectrum.
Current usage metrics show cumulative count of Article Views (full-text article views including HTML views, PDF and ePub downloads, according to the available data) and Abstracts Views on Vision4Press platform.
Data correspond to usage on the plateform after 2015. The current usage metrics is available 48-96 hours after online publication and is updated daily on week days.
Initial download of the metrics may take a while.