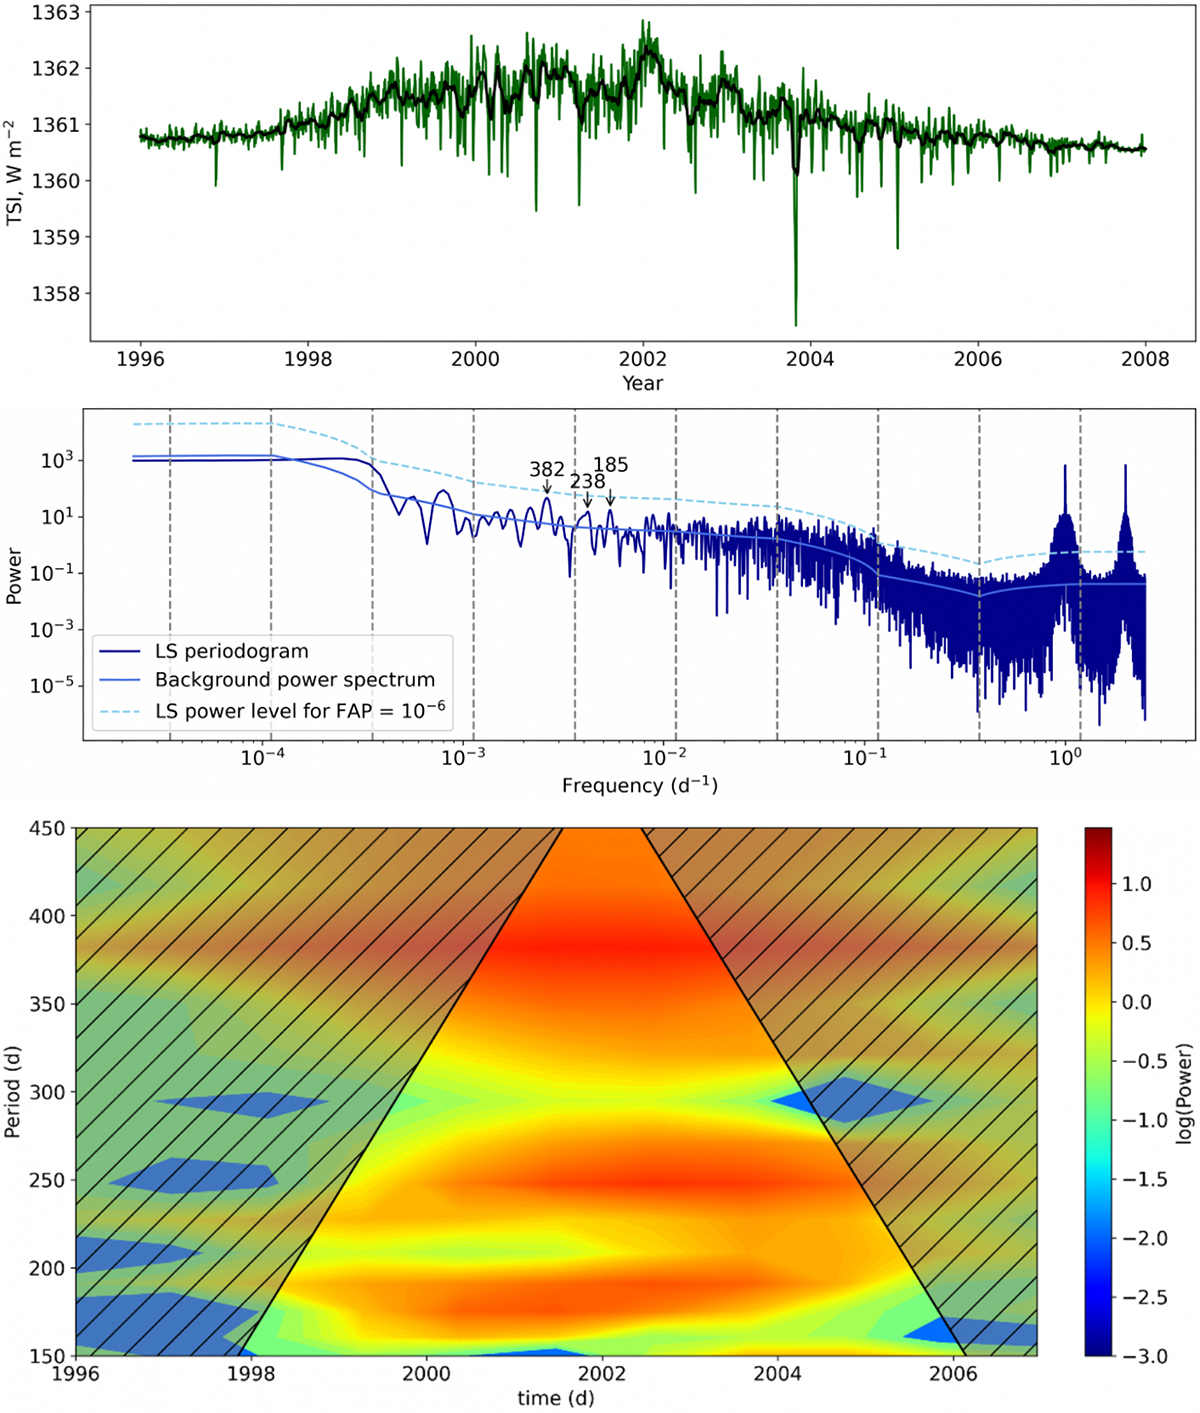
Fig. 3.
Download original image
Upper panel: Total irradiance of the Sun during cycle 23 based on SOHO/VIRGO data. The solid black line corresponds to the 30-d moving average. Medium panel: LS analysis of the TSI data for the whole frequency range. The meaning of lines and arrows are the same as in Fig. 1. Bottom panel: Wavelet analysis of the TSI in the range 150−450 d. The significance level of all power peaks is below 5% and for this reason the confidence level contours are not plotted. We only consider peaks that are consistent with Rieger periodicity and 1-year cycle. Longer period features are not classified as Rieger-type cycles.
Current usage metrics show cumulative count of Article Views (full-text article views including HTML views, PDF and ePub downloads, according to the available data) and Abstracts Views on Vision4Press platform.
Data correspond to usage on the plateform after 2015. The current usage metrics is available 48-96 hours after online publication and is updated daily on week days.
Initial download of the metrics may take a while.