Fig. C.2
Download original image
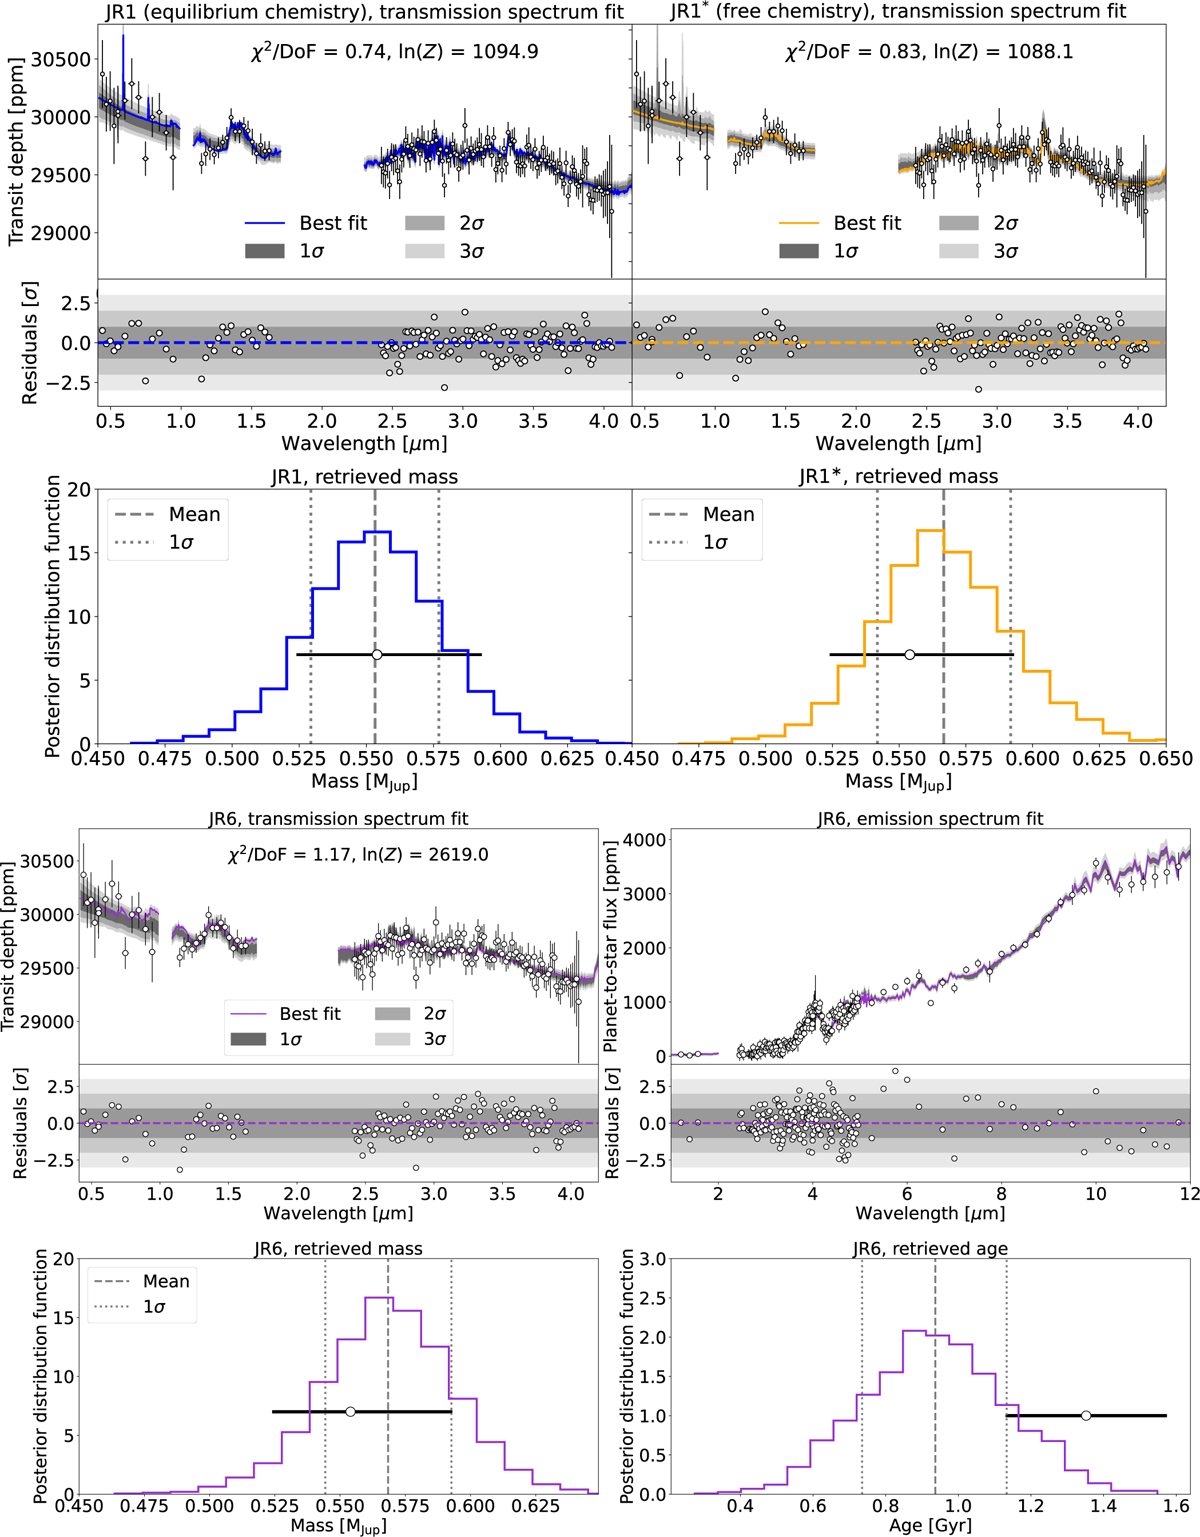
First row: Best-fit models for our joint retrievals of WASP-80 b JR1 (equilibrium chemistry; left panel) and JR1* (free chemistry; right panel). Second row: Posterior distribution function (PDF) of the retrieved masses for JR1 and JR1*. Dashed and dotted lines indicate the mean and standard deviations of the PDFs. White circles indicate the observed data with their respective uncertainties in all four panels. Third and fourth rows: Best-fit model for our joint retrieval JR6.
Current usage metrics show cumulative count of Article Views (full-text article views including HTML views, PDF and ePub downloads, according to the available data) and Abstracts Views on Vision4Press platform.
Data correspond to usage on the plateform after 2015. The current usage metrics is available 48-96 hours after online publication and is updated daily on week days.
Initial download of the metrics may take a while.