Fig. 2
Download original image
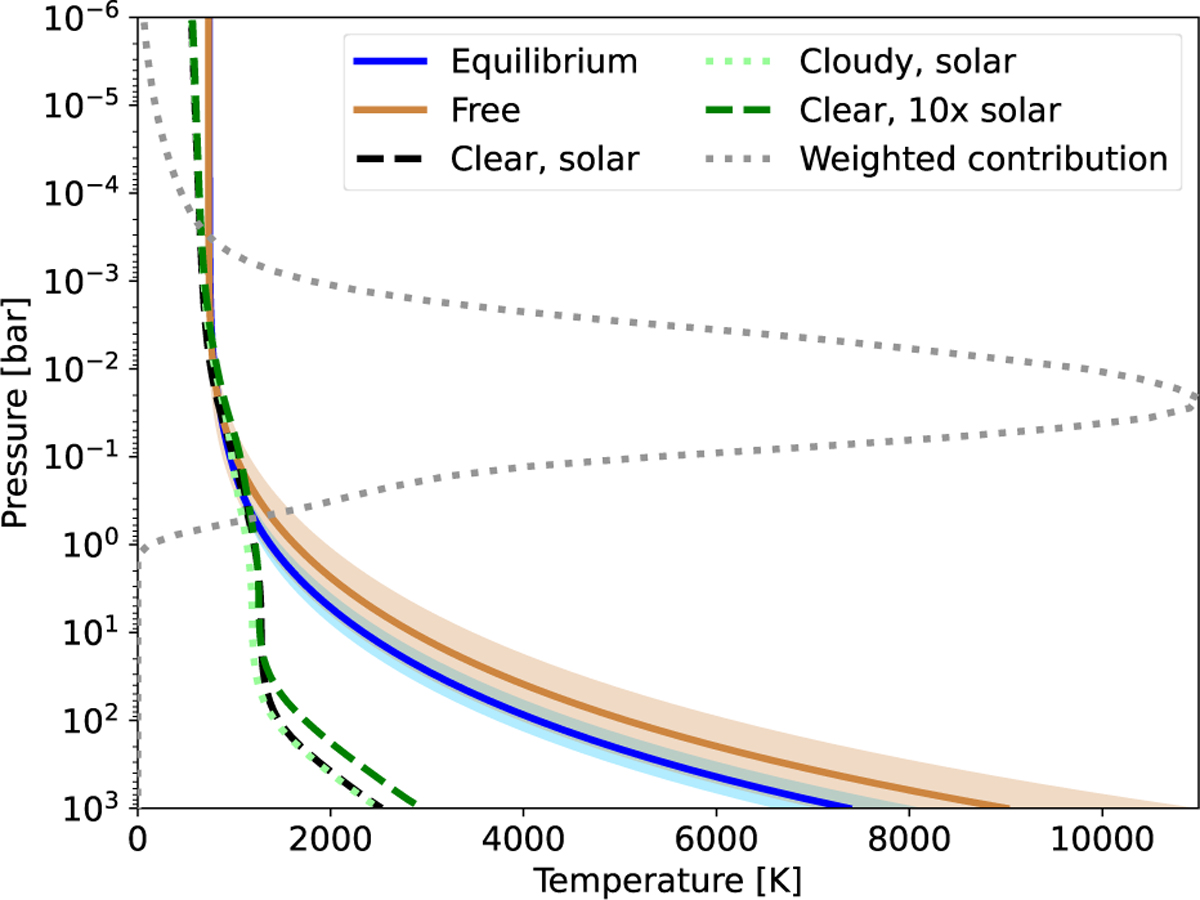
P–T profile of WASP-80 b as constrained by our two emission-only retrievals. The shaded region indicates the 1σ area of the retrieval, while solid lines correspond to the mean. We show self-consistent 1D models from Mollière et al. (2017) for comparison, including cloudy model 1 in their Table 2 (see text). The dotted gray line shows the contribution function from our emission-only retrievals.
Current usage metrics show cumulative count of Article Views (full-text article views including HTML views, PDF and ePub downloads, according to the available data) and Abstracts Views on Vision4Press platform.
Data correspond to usage on the plateform after 2015. The current usage metrics is available 48-96 hours after online publication and is updated daily on week days.
Initial download of the metrics may take a while.