Fig. 3.
Download original image
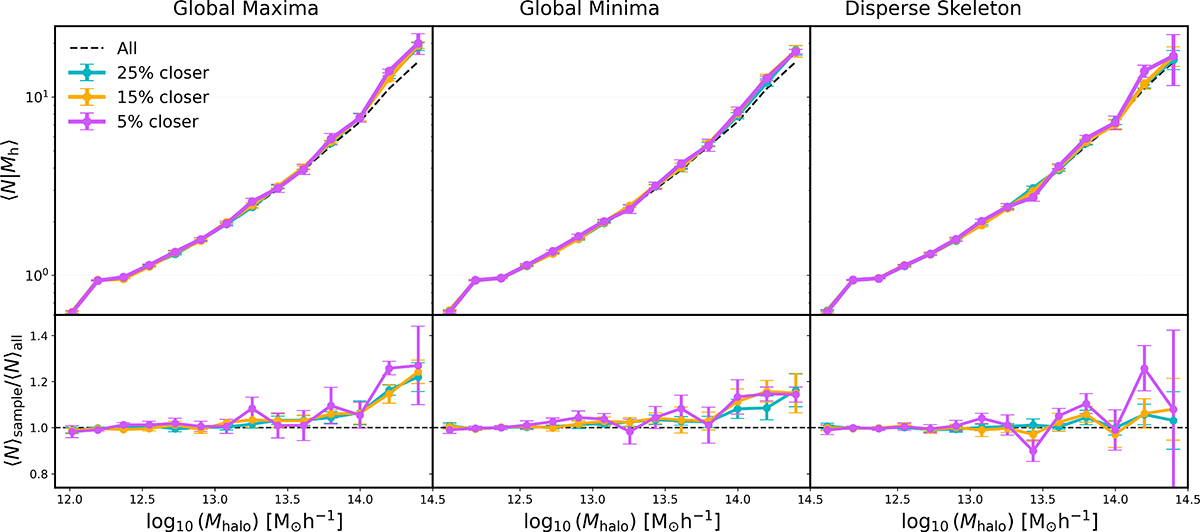
HODs as a function of halo mass for groups at different proximity thresholds. Upper panels: HODs for subsamples within 25% (cyan), 15% (orange), and 5% (violet) of the nearest global maxima (left), global minima (center), and DisPerSE skeleton (right), compared to the complete sample (dashed black line). Lower panels: Ratios of each sample HOD to the complete sample HOD. The larger fluctuations at high masses reflect the smaller number of halos in these regimes. Error bars represent jackknife uncertainties estimated using 100 spatial subsamples. All results correspond to the absolute magnitude cut Mr < −20.0.
Current usage metrics show cumulative count of Article Views (full-text article views including HTML views, PDF and ePub downloads, according to the available data) and Abstracts Views on Vision4Press platform.
Data correspond to usage on the plateform after 2015. The current usage metrics is available 48-96 hours after online publication and is updated daily on week days.
Initial download of the metrics may take a while.