| Issue |
A&A
Volume 706, February 2026
|
|
|---|---|---|
| Article Number | A42 | |
| Number of page(s) | 12 | |
| Section | Cosmology (including clusters of galaxies) | |
| DOI | https://doi.org/10.1051/0004-6361/202556548 | |
| Published online | 28 January 2026 | |
The invariance of group occupation across the cosmic web
1
Departamento de Física, Universidad Técnica Federico Santa María Av. España 1680 Valparaíso, Chile
2
CONICET. Instituto de Astronomía Teórica y Experimental (IATE). Laprida 854 Córdoba X5000BGR, Argentina
3
Universidad Nacional de Córdoba (UNC). Observatorio Astronómico de Córdoba (OAC) Laprida 854 Córdoba X5000BGR, Argentina
4
Departamento de Física, Universidad Técnica Federico Santa María Avenida Vicuña Mackenna 3939 San Joaquín Santiago, Chile
★ Corresponding author: This email address is being protected from spambots. You need JavaScript enabled to view it.
Received:
22
July
2025
Accepted:
12
November
2025
Abstract
Context. Recent efforts to identify secondary variations in the halo occupation distribution (HOD) have primarily focused on simulations that examine the role of large-scale cosmic environments, such as superclusters, filaments, and under-dense regions or voids. If present, these variations can yield valuable insights into galaxy formation mechanisms, halo assembly processes, and the influence of external factors on the evolution of cosmic structure.
Aims. We aim to explore whether the secondary trends in the HOD driven by the large-scale structure of the Universe are present observationally. In particular, we examined whether the HOD depends on the distance to key features of the cosmic web by explicitly quantifying these spatial relationships. We further analyzed whether HODs vary across different cosmic environments, as defined by critical point classifications, and assessed the influence of intrinsic galaxy properties, such as the central galaxy color.
Methods. We created volume-limited galaxy samples from SDSS DR18 and used a group catalog to determine halo masses and to identify central and satellite galaxy membership. Additionally, we employed a DisPerSE catalog to locate critical points such as maxima, minima, and filaments in the cosmic web. We assessed how the HOD varies based on proximity to these features and analyzed these variations across five distinct cosmic environments. Furthermore, we investigated trends related to the color of central galaxies and tested the reliability of our results by using alternative DisPerSE catalogs generated with different smoothing scales and persistence thresholds.
Results. Our analysis confirms that the large-scale cosmic environment only weakly influences the HOD. However, second-order environmental dependences might be revealed through a multivariate approach that combines both local and large-scale environment metrics with intrinsic galaxy properties. Future investigations that employ next-generation surveys with improved statistical power, coupled with sophisticated modeling techniques, may provide the necessary precision to detect and characterize these subtle environmental correlations.
Key words: methods: statistical / galaxies: groups: general / galaxies: halos / dark matter / large-scale structure of Universe
© The Authors 2026
 Open Access article, published by EDP Sciences, under the terms of the Creative Commons Attribution License (https://creativecommons.org/licenses/by/4.0), which permits unrestricted use, distribution, and reproduction in any medium, provided the original work is properly cited.
This article is published in open access under the Subscribe to Open model. This email address is being protected from spambots. You need JavaScript enabled to view it. to support open access publication.
1. Introduction
The formation and evolution of galaxies within the cosmic web represents one of the most complex challenges in modern astrophysics. According to the standard paradigm of hierarchical structure formation, galaxies form and evolve within the potential wells of dark matter halos (White & Rees 1978). While the growth of these halos is governed primarily by gravitational processes such as accretion and mergers (Springel et al. 2005; Wechsler & Tinker 2018), the resulting galaxy populations are shaped by a rich interplay of baryonic physics, including gas cooling, star formation, and various feedback mechanisms (Baugh 2006; Somerville & Davé 2015; Naab & Ostriker 2017). The different timescales involved in halo mergers compared to galaxy mergers further complicate this picture, as galaxies may retain their identity long after their host halos have merged, making galaxy evolution sensitive to both the local baryonic processes and the larger-scale dynamical history of the halo environment (Lacey & Cole 1994; Hopkins et al. 2008).
The halo occupation distribution (HOD) framework has proven to be one of the most successful approaches for quantifying the relationship between galaxies and their host halos. By characterizing the statistical distribution of galaxies within dark matter halos as a function of halo mass (Berlind & Weinberg 2002; Cooray & Sheth 2002), the HOD provides a powerful tool for connecting theoretical predictions with observational data. This methodology has found numerous applications across astrophysical research. It has been used extensively to interpret galaxy clustering measurements, providing insights into how different galaxy populations trace the underlying matter distribution (Zheng et al. 2005; Zehavi et al. 2011). The HOD framework has enabled detailed studies of galaxy demographics, revealing how various galaxy types occupy halos of different masses across redshift (e.g., Tinker et al. 2008; Contreras et al. 2017; Contreras & Zehavi 2023). Furthermore, it has become an essential component in the construction of the realistic mock galaxy catalogs needed for survey planning and analysis (Behroozi et al. 2019). Perhaps most significantly, the HOD has emerged as a valuable tool for cosmological studies, offering constraints on fundamental parameters through its connection to galaxy bias and large-scale structure (McCracken et al. 2015; Avila et al. 2020). The widespread adoption of the HOD approach stems from its unique combination of physical insight, flexibility, and computational efficiency (Kravtsov et al. 2004; van den Bosch et al. 2013).
Recent advances in our understanding of galaxy formation have revealed that the HOD depends not only on halo mass but also on the larger-scale environment in which halos reside (Zentner et al. 2014; Salcedo et al. 2020). Significant variations appear in regions of extreme density contrast. In the under-dense environments of cosmic voids, halos consistently show reduced occupation numbers compared to field halos of similar masses, along with characteristically later formation times (Tinker et al. 2006; Tinker & Conroy 2009; Alfaro et al. 2020, 2022). Conversely, in over-dense environments and future virialized structures, halos exhibit higher occupation numbers and accelerated evolutionary time lines (Aragón-Calvo et al. 2010; Cautun et al. 2014; Alfaro et al. 2021, 2022). These environmental dependences reflect fundamental differences in halo assembly histories and the resulting galaxy formation efficiency (Ricciardelli et al. 2014; Pollina et al. 2017; Alfaro et al. 2020). The environment and the geometry of the tidal field around halos have also been invoked to explain secondary halo bias effects such as halo assembly bias1 (e.g., Sheth & Tormen 2004; Gao et al. 2005; Dalal et al. 2008; Borzyszkowski et al. 2017; Musso et al. 2018; Paranjape et al. 2018; Sato-Polito et al. 2019; Ramakrishnan et al. 2019; Contreras et al. 2019; Ramakrishnan & Paranjape 2020; Tucci et al. 2021; Contreras et al. 2021; Balaguera-Antolínez et al. 2024; Montero-Dorta et al. 2025), which might also impact galaxy clustering and the HODs (e.g., Zehavi et al. 2018; Artale et al. 2018; Montero-Dorta et al. 2020, 2021; Wang et al. 2022; Montero-Dorta & Rodriguez 2024; Alam et al. 2024; Kim et al. 2025).
The cosmic web – the intricate network of voids, filaments, walls, and nodes that constitutes the large-scale structure of the Universe – provides the essential environmental context for understanding these variations in galaxy occupation (Bond et al. 1996; Libeskind et al. 2017). Voids, which dominate the volume of the Universe, represent regions of exceptionally low density where galaxy formation is strongly suppressed due to both the lack of material and the expansion-dominated dynamics of these regions (Ceccarelli et al. 2013; Hamaus et al. 2014). Filaments form the connecting bridges between these voids, channeling matter flows toward the denser nodes and influencing the properties of galaxies along these pathways (Tempel et al. 2014; Malavasi et al. 2016). The nodes, where multiple filaments intersect, correspond to the densest regions of the cosmic web and typically host massive galaxy clusters (Aragón-Calvo et al. 2010; Hahn et al. 2007). This environmental diversity across the cosmic web drives the observed heterogeneity in galaxy population properties and their occupation statistics (Dekel et al. 2009; Kraljic et al. 2018; Rodriguez et al. 2025; Alfaro et al. 2025), making the environmental context an essential consideration for any complete understanding of galaxy formation.
Using Illustris-TNG hydrodynamical simulations (Pillepich et al. 2018a,b; Springel et al. 2018), Perez et al. (2024) studied how the cosmic web affects the HOD. They focused on analyzing how HODs change in halos found in filaments and nodes. Their findings reveal a strong correlation between the HOD of halos in filaments and the overall galaxy sample, suggesting that halo mass is the most significant factor affecting galaxy distribution. In contrast, nodes exhibit an excess of faint galaxies in lower-mass halos and a bimodal color distribution among low-mass galaxies, indicating signs of early reddening.
In this work we investigated potential secondary dependences of the HOD on the large-scale cosmic environment, using spectroscopic data from the Sloan Digital Sky Survey (SDSS; York et al. 2000). Specifically, we aimed to determine whether the number of galaxies within halos varies systematically with proximity to prominent features of the cosmic web and across distinct environmental classifications. To this end, we combined group catalog data obtained through a halo-based group identification algorithm (Rodriguez & Merchán 2020) with a cosmic web classification based on the DisPerSE algorithm (Malavasi et al. 2020). This analysis is particularly relevant as a means of constraining the halo–galaxy connection from observations.
The remainder of this paper is structured to systematically explore the relationship between galaxy occupation statistics and the cosmic environment. In Sect. 2 we present the observational datasets that form the basis of our analysis, with a particular focus on the cosmic web critical point sample and its distinctive features. Section 3 details our methodology for cosmic environment classification, explaining the quantitative criteria we used to distinguish voids, filaments, and nodes within the large-scale structure. The core of our analysis appears in Sect. 4, where we present a comprehensive examination of the environmental dependence of halo occupation statistics, including the systematic variations across different cosmic web environments and their statistical significance. Finally, Sect. 5 synthesizes our principal findings and their implications for galaxy formation theory, and presents promising directions for future research in this field. Throughout this paper we adopt a Planck Collaboration XXVII (2016) cosmology, with H0 = 67.74 km s−1 Mpc−1, Ωm = 0.3075, and ΩΛ = 0.6925. Equatorial coordinates are given in the J2000 reference frame.
2. Data
In this section we provide a detailed description of the three catalogs utilized in this study: the galaxy catalog, the galaxy groups catalog, and the DisPerSE critical points catalog.
2.1. SDSS galaxy sample
The SDSS is one of the most comprehensive astronomical surveys ever conducted, providing a detailed map of the sky with a focus on understanding the large-scale structure of the Universe (York et al. 2000). Since its inception, SDSS has delivered high-quality photometric and spectroscopic data for millions of celestial objects, enabling a wide range of astrophysical studies. Observations are carried out using a 2.5-meter telescope at Apache Point Observatory in New Mexico, USA. The telescope is equipped with a wide-field imaging camera and a spectrograph that covers five optical bandpasses (u, g, r, i, z). The spectrograph is capable of obtaining up to 1000 spectra simultaneously over a wavelength range of 3800–9200 Å with a resolution of λ/Δλ ∼ 2000 (Maraston et al. 2009).
The 18th data release (DR18) of the SDSS marks the first release for SDSS-V, the fifth generation of the survey. SDSS-V comprises three primary scientific programs: the Milky Way Mapper (MWM), the Black Hole Mapper (BHM), and the Local Volume Mapper (Almeida et al. 2023). DR18 includes extensive targeting information for the multi-object spectroscopy programs (MWM and BHM), providing input catalogs and selection functions for a wide array of scientific objectives. It also incorporates all previous SDSS data releases, covering more than 14 000 deg2 of the sky and offering spectroscopic data for millions of galaxies, stars, and quasars. Furthermore, DR18 adds approximately 25 000 new SDSS spectra, along with supplemental information for X-ray sources identified by eROSITA in its eFEDS field.
For our analysis, we used the SDSS DR18 Main Galaxy Sample (MGS), which provides a robust dataset for studying the large-scale distribution of galaxies. We focused on galaxies within the Legacy footprint area, applying magnitude and redshift constraints to construct a volume-limited sample suitable for tracing cosmic structures. Specifically, we selected galaxies with apparent r-band magnitudes brighter than 17.77 and redshifts below 0.3, consistent with previous studies using SDSS data (Strauss et al. 2002). To ensure uniform completeness across the sample, we imposed a redshift limit of zlim = 0.1 and a corresponding absolute magnitude threshold of Mr = −19.77. This selection yields a well-defined and nearly uniform sample across the surveyed area, ideal for identifying filaments, nodes, and voids.
2.2. Galaxy group catalog
Galaxy groups are observational tracers of dark matter halos and are fundamental for exploring the galaxy–halo connection. In this work we used a group catalog from SDSS DR18, constructed using the method developed by Rodriguez & Merchán (2020). This approach combines a friends-of-friends (FoF) algorithm (Huchra & Geller 1982; Merchán & Zandivarez 2005) with a halo-based refinement procedure (Yang et al. 2007), enabling the identification of gravitationally bound systems and the assignment of physical halo properties.
The FoF algorithm initially links galaxies into candidate groups based on their projected separation and line-of-sight velocity differences. These preliminary associations are then refined iteratively using an abundance matching technique (Vale & Ostriker 2004; Kravtsov et al. 2004; Behroozi et al. 2010), which estimates halo masses by assuming a monotonic relationship between total group luminosity and halo mass. This iterative process continues until convergence is reached in both group membership and halo mass estimates.
The resulting catalog spans a broad range of systems – from small groups to rich clusters – and provides key properties such as galaxy membership, halo mass (Mgroup), and spatial coordinates. Halo mass estimates from this catalog are in good agreement with independent measurements from weak gravitational lensing (Gonzalez et al. 2021), and the group properties have been shown to reproduce the observed central–satellite distributions seen in simulations (Alfaro et al. 2022; Rodríguez-Medrano et al. 2023).
In this framework, the brightest galaxy in each group is classified as the central galaxy, while the remaining members are considered satellites. For this study, we restricted our analysis to groups with at least one spectroscopic member to ensure reliable estimates of group properties and robust measurements of the HOD.
2.3. DisPerSE critical points sample
The cosmic web filaments and critical points in this study were identified using DisPerSE (Sousbie et al. 2011; Sousbie 2011), which applies discrete Morse theory to three-dimensional galaxy distributions. The algorithm first reconstructs the density field using the Delaunay tessellation field estimator (DTFE) method (Schaap & van de Weygaert 2000; van de Weygaert & Schaap 2009), creating a tetrahedral mesh from galaxy positions and computing densities through local averaging. To systematically investigate the impact of noise and spatial scale on our results, we employed three distinct levels of smoothing: unsmoothed (SD0), single smoothing (SD1), and double smoothing (SD2). Within the DTFE framework, a single smoothing cycle is typically implemented as one iteration where the density at each vertex of the Delaunay tessellation is replaced by the average of the densities at its directly connected neighboring vertices. This process, equivalent to a diffusion step on the irregular mesh, effectively suppresses small-scale fluctuations and shot noise inherent in the discrete galaxy distribution. The result is a more coherent and continuous density field, achieved at the cost of blurring the finest structural details. Consequently, the SD0 (unsmoothed) field captures the rawest topological features, potentially including artifacts from shot noise, while SD1 (one iteration) provides a balanced view by enhancing the connectivity of the most significant structures. The SD2 (two iterations) field represents a progressively coarser representation, highlighting only the most prominent and large-scale features of the cosmic web. This multi-scale approach allowed us to distinguish robust, large-scale filaments from potentially spurious detections that may be sensitive to small-scale density variations.
Critical points (maxima, minima, and saddles) are located where the density gradient vanishes, with filaments traced as field lines connecting maxima to saddles. Persistence filtering at 3σ and 5σ thresholds (Sousbie 2011; Malavasi et al. 2017) removes noise-induced features, where 5σ retains only the most significant structures.
The identification of cosmic web structures in this study is based on the filament catalogs generated with the DisPerSE algorithm and made publicly available by Malavasi et al. (2020). In their work, DisPerSE was applied to the MGS of SDSS DR12, producing multiple catalogs of critical points and filaments by varying both the smoothing scale of the galaxy density field and the persistence threshold that controls the significance of topological features. These catalogs provide a detailed and flexible mapping of the cosmic web, including the positions of nodes, saddles, and filamentary structures. The datasets used in this analysis were obtained from an online repository2 and serve as the basis for our characterization of the large-scale environment. The robustness of the DisPerSE method and the systematic exploration of its parameters make it particularly well suited for studies of the cosmic web.
To associate galaxy groups with these cosmic web structures, we followed the matching procedure outlined in the same work. This involves converting galaxy positions from celestial coordinates to comoving Cartesian space, ensuring compatibility with the coordinate system of the filament catalogs and enabling a consistent spatial comparison between galaxy groups and cosmic web features. The spatial distribution of critical points (nodes, voids, and saddles) is shown in Fig. 1, in a redshift slice centered on the Coma cluster.
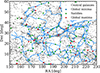 |
Fig. 1. Galaxy and critical point distribution in a ±75 Mpc redshift slice centered on the Coma cluster. Gray points are central galaxies from the SDSS MGS sample. Large circles are DisPerSE critical points color-coded by type (nodes, voids, and saddles). A single smoothing of the density field was applied before structure identification. |
3. Cosmic environment classification
As a preliminary step toward understanding how the galaxy–halo connection varies with environment, we first examined the distances between galaxy groups and the critical points of the cosmic web identified by DisPerSE, such as nodes and filaments. While these distances do not define discrete environments, they serve as a first-order proxy for the large-scale structure and allow us to explore how halo occupation properties change as a function of proximity to cosmic web features.
To obtain a more physically motivated and discrete classification of the large-scale environment, we applied the method proposed by Galárraga-Espinosa et al. (2023) and implemented, for example, in Rodriguez et al. (2025), which assigns galaxies to well-defined components of the cosmic web. This approach uses distances to the structures identified by DisPerSE, combined with threshold criteria, to segment the cosmic web into five distinct environments:
-
Clusters: Spherical regions of radius R200 [h−1 Mpc] centered on FoF halos with masses M ≥ 1013 M⊙ h−1. Galaxies within R200 of such halos are considered part of this environment.
-
Cluster outskirts: Spherical shells extending from R200 to 3R200 around massive halos, representing galaxies still under the cluster’s gravitational influence but outside its virialized core.
-
Filaments: Ridges of the density field connecting pairs of nodes, as identified by the DisPerSE skeleton. Galaxies located within 1 h−1Mpc of a filament axis are assigned to this environment.
-
Filament outskirts: Regions located between 1 and 2 h−1Mpc from a filament axis, corresponding to galaxies near filaments but not embedded in their central spines.
-
Others: Galaxies not associated with clusters or filaments. These typically reside in low-density regions of the cosmic web and are more isolated from prominent structures.
This classification provides a robust and interpretable segmentation of the large-scale environment, which we use in Sect. 4.2 to analyze variations in the HOD. Galaxies are uniquely assigned to one of these environments, ensuring that no overlap occurs between categories. Throughout this work, R200 refers to R200c, the radius enclosing 200 times the critical density of the Universe, ρcrit(z) = 3H2(z)/(8πG).
Figure 2 illustrates the spatial distribution of galaxies across the five environments defined above. Filamentary features were extracted using the DisPerSE algorithm. Galaxies classified as filaments lie within 1 h−1Mpc of a filament axis, while those located in filament outskirts are located between 1 and 2 h−1Mpc. This visualization, based on our SDSS DR18 dataset, offers an intuitive depiction of how galaxies trace the underlying large-scale structure.
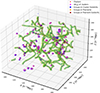 |
Fig. 2. Three-dimensional visualization of the five cosmic environments used in our analysis: galaxy clusters (red), cluster outskirts (blue), filaments (yellow), filaments outskirts (brown). Groups are shown as transparent magenta spheres, with radii equal to 3 times the R200 of each halo. Galaxies classified as filaments lie within 1 h−1 Mpc of the filament axis, while those in filament outskirts lie between 1 and 2 h−1 Mpc. This figure was generated using our SDSS DR18 dataset and environment classification scheme. |
4. Exploring potential variations in the HOD across the cosmic web
4.1. Analysis as a function of the distance to DisPerSE critical points
Throughout this work, we refer to DisPerSE maxima as global maxima, minima as global minima, and filaments as the DisPerSE skeleton. We first investigated whether the HOD correlates with the distance to the nearest such critical point. For this analysis, group subsamples were selected based on the distances measured from the central galaxies of each group to the critical points, with subsequent inclusion of their satellite galaxies. We chose central galaxies to define these distances because they are typically located near the potential minimum of their host halos and are less affected by redshift-space distortions compared to satellites. As a result, their positions provide more stable and physically meaningful references for measuring proximity to large-scale structures. We considered groups within the 25%, 15%, and 5% closest distances to each critical point type, as identified by DisPerSE. Jackknife uncertainties were computed using 100 subsamples, with tests confirming stable variance for ≥50 subsamples. Notably, the error bars increase significantly at the highest mass bins due to the decreasing number of halos in these regimes. The fundamental limitation of this distance-based approach is its inability to isolate pure environments. While a group may be classified as close to a global maxima, its central galaxy (and consequently the whole group) might simultaneously reside near a filament or global minima, creating ambiguous environmental classifications. This problem originates because DisPerSE identifies only discrete critical points without characterizing their spatial extent or overlaps, as noted in similar analyses by Montero-Dorta & Rodriguez (2024). Figure 3 shows the occupation distributions for the magnitude threshold Mr < −20.0, representative of the behavior observed across all thresholds considered (Mr < −21.0, −20.5, −20.0, and −19.76). We display only this case for clarity, as the trends remain consistent for the other cuts. Across all mass bins, there are no significant HOD variations between the proximity-selected subsamples and the complete sample. Though the larger uncertainties at high masses preclude strong conclusions in these extreme regimes, the HOD ratios (lower panels) fluctuate minimally around unity, confirming that critical point distances alone lack predictive power for halo occupation.
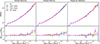 |
Fig. 3. HODs as a function of halo mass for groups at different proximity thresholds. Upper panels: HODs for subsamples within 25% (cyan), 15% (orange), and 5% (violet) of the nearest global maxima (left), global minima (center), and DisPerSE skeleton (right), compared to the complete sample (dashed black line). Lower panels: Ratios of each sample HOD to the complete sample HOD. The larger fluctuations at high masses reflect the smaller number of halos in these regimes. Error bars represent jackknife uncertainties estimated using 100 spatial subsamples. All results correspond to the absolute magnitude cut Mr < −20.0. |
Given these limitations, we proceeded with the more rigorous environment classification from Sect. 3, which explicitly accounts for the multidimensional nature of cosmic structures while maintaining the central galaxy-based distance measurements as our fundamental reference.
4.2. Variations across different environments
Using a methodology similar to the one described above, and the environments defined in Sect. 3, we obtained and analyzed the HODs across different environments. As shown in Table 1, although the number of groups classified as belonging to the Clusters environment is relatively small, these groups contain a disproportionately large number of galaxies. This is consistent with the definition of clusters as dense, highly populated structures.
Number of groups and galaxies in each environment.
Figure 4 presents the HODs for galaxy groups classified by environment, across all magnitude-limited samples. The top panels show the HODs for each environment, allowing a direct comparison of occupation trends, while the bottom panels display the ratio of each environmental HOD to that of the full sample, highlighting relative deviations.
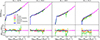 |
Fig. 4. HODs across cosmic environments for magnitude-limited samples (Mr < −19.76, −20.0, −20.5, and −21.0). Top panels: Mean occupation number versus halo mass for the overall sample (black line) compared to individual environments: clusters (pink), cluster outskirts (red), filaments (green), filament outskirts (yellow), and others (blue). Bottom panels: Ratio of each environment’s HOD to the overall sample. Error bars indicate jackknife uncertainties from 100 spatial subsamples. |
Across the low- and intermediate-luminosity thresholds (the first three panels in Fig. 4), the HODs exhibit a high degree of consistency between environments and the full sample. In most cases, the environmental curves closely follow the overall trend (black line), with their ratios remaining near unity and typically fluctuating by less than 10% over the full halo mass range. This suggests that large-scale environment plays only a limited role in shaping halo occupation. Cluster environments show well-constrained HODs, with uncertainties around 3–5%. Their outskirts display similarly stable behavior, with slightly larger but still controlled errors. Filamentary environments exhibit greater variation: filament cores show the highest uncertainties, up to 15–20% in low-occupancy bins, due to low number statistics, while filament outskirts show intermediate scatter, but remain broadly consistent with the global trend within uncertainties.
A notable exception to the aforementioned trend appears for the brightest galaxy sample (Mr < −21.0), where intermediate-mass groups classified in filament cores show a systematic tendency toward lower occupation numbers relative to the full sample (by 15–20%). Although this trend is limited by statistical uncertainties, it may indicate a reduced efficiency of galaxy formation in these lower-density environments at high luminosities. The environment labeled as others displays small statistical uncertainties due to its large sample size. However, since it includes all regions not identified as clusters or filaments, it likely encompasses a heterogeneous mix of environments. As such, we refrain from interpreting any physical trends from this category.
Overall, except for the potential suppression seen in filament cores at the brightest luminosities, the HODs remain fairly similar across environments. These results reinforce the idea that halo mass is the dominant factor governing galaxy occupation, with minimal modulation by large-scale environment within the sensitivity of our current analysis.
4.3. Variations across environments and color
Building on our environmental analysis, we next examined how galaxy color influences the HOD across different environments. We classified central galaxies as red ((g − r) > 0.83) or blue ((g − r)≤0.83) following Rodriguez et al. (2022), while preserving their satellite populations to maintain group integrity in our HOD calculations. This approach allowed us to investigate potential correlations between central galaxy properties and their halo occupation patterns in different cosmic environments. Figure 5 presents the color-dependent HOD analysis, organized in two distinct rows. The upper row displays the HODs and their corresponding ratios for red central galaxies across all environmental classes, while the lower row shows the equivalent results for blue centrals. Each column represents a different magnitude threshold (Mr < −19.76, −20.0, −20.5, and −21.0), with the black line indicating the overall sample and colored symbols marking the environmental subsamples. The ratio panels displays how each environment’s occupation compares to the HOD of all galaxies of the same color, maintaining the classification scheme established in Sect. 4.2. For red central galaxies, the HOD follows the global trend across all environments and halo masses. However, blue central galaxies exhibit a systematically lower number of satellite galaxies, particularly in halos with higher masses.
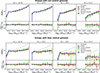 |
Fig. 5. HODs segregated by galaxy color and environment. Top row: HODs (left) and their corresponding ratios (right) for red central galaxies ((g − r) > 0.83). Bottom row: Equivalent analysis for blue centrals ((g − r)≤0.83). Each column represents a different magnitude cut (Mr < −19.76, −20.0, −20.5, and −21.0). Solid black lines show the complete sample (“all”), while colored symbols represent environmental subsamples (clusters, cluster outskirts, filaments, filament outskirts, and others). Ratio panels compare each environment’s HOD to the corresponding color-classified complete sample (all red or all blue). |
In the combined population (Fig. 4) deviations appeared for the brightest galaxy sample (Mr < −21.0), where intermediate-mass groups in filaments showed a systematic tendency toward lower occupation numbers. By separating galaxies into blue and red populations in Fig. 5, we find that this effect can be mostly attributed to red central galaxies (upper row).
The subpanels of Fig. 5 display the ratio of the HOD in each environment to the general population of galaxies of the same color. For both red and blue central galaxies, these ratios remain close to unity, suggesting that the occupation number is consistent across environments. For blue centrals, the HODs show a larger scatter, particularly in environments like filaments and others, where the number of satellites is reduced.
To further investigate the environmental dependence of satellite galaxy populations, Fig. 6 shows the ratio of satellites hosted by red versus blue central galaxies as a function of halo mass, separated by environment. Across all environments and magnitude thresholds (Mr < −21.0, Mr < −20.5, etc.), red centrals host significantly more satellites than blue centrals, with the disparity increasing sharply with halo mass. Figure 6 once again shows the modest impact of large-scale environment on halo occupation, with the satellite ratio depending primarily on halo mass. As expected, filaments appear to slightly deviate from this general trend, displaying a relatively flat behavior at higher halo masses, although the uncertainties prevent us from drawing any firm conclusions.
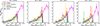 |
Fig. 6. Red-to-blue galaxy ratio (Nred/Nblue) as a function of halo mass (log10(Mhalo/[M⊙h−1]) for different galactic environments (color-coded) and four magnitude cuts (panels). The ratio increases systematically with halo mass in all environments, with the steepest growth occurring in the densest regions (clusters > cluster outskirts > filaments > filament outskirts > field). This mass- and density-dependent trend persists consistently across all magnitude cuts. Error bars show propagated uncertainties from jackknife-estimated HOD errors. |
In order to quantify the significance of these fluctuations, we computed the ratio of the HOD in each environment to the full-sample HOD and evaluated the deviations relative to the jackknife uncertainties. For each halo mass bin we defined a Z-score as (R − 1)/σR, and also calculated global χ2 values and p-values for the null hypothesis that the environmental HODs are consistent with the full sample. Averaged across all bins, the typical deviations are modest, with ⟨|Z|⟩ ≲ 1 in most environments. At higher halo masses, however, we detect statistically significant differences: cluster outskirts display marginal departures (⟨|Z|⟩ ≈ 1–2, p ≈ 0.05–0.25), while red centrals in filaments at Mr < −21 show the strongest deviations (⟨|Z|⟩ ≈ 2.6, p ≪ 0.01). For blue centrals, significant differences are also found in cluster outskirts (p = 0.002) and filaments (p = 0.02) at the brightest magnitude cut. In contrast, galaxies in the others category are always consistent with the global HOD (p ≈ 1). These quantitative tests confirm that the strongest environmental differences are confined to massive halos and to specific environments, while most others remain statistically indistinguishable from the global trend.
These trends align with established observational results on satellite quenching and galactic conformity. Peng et al. (2012) and Wetzel et al. (2013) demonstrated that satellites in halos with red centrals are more likely to be quenched, particularly in massive systems, while Zehavi et al. (2011) showed that the HOD is strongly color-dependent, with red centrals hosting more satellites at fixed halo mass. The physical interpretation aligns with recent findings on environmental processing timescales. Specifically, Oxland et al. (2024) show that, in dense environments, star formation is quenched more rapidly than morphological transformation, with preprocessing mainly impacting star formation activity. This supports our scenario where red centrals, typically residing in massive halos and formed through mergers, are associated with halos that are more efficient at retaining satellites and promoting their quenching. Here, we do not mean that the central galaxy itself directly quenches its satellites, but rather that the halos hosting red centrals provide conditions that favor earlier infall and more efficient quenching. Conversely, blue centrals, generally at earlier evolutionary stages with ongoing star formation and active feedback, tend to retain fewer satellites. Accelerated quenching in dense environments further explains why the difference in satellite fractions between red and blue centrals is most pronounced in clusters, where environmental effects are strongest.
4.4. Robustness tests
To ensure the reliability of our conclusions, we assessed the robustness of the results against variations in the methodological choices, particularly those related to the identification of the cosmic web. Since our environmental classification relies on structures detected by DisPerSE, it is crucial to understand how sensitive our findings are to the algorithm’s internal parameters. By systematically varying these parameters, we can evaluate the stability of the derived environmental trends and verify that our main conclusions are not artifacts of a specific configuration. In this section we explore how DisPerSE’s parameters, specifically persistence and smoothing (see Sect. 2.3), influence the detection and characterization of structures within the cosmic web. These parameters control the statistical significance and geometric smoothing of the identified features, enabling a tailored analysis of the cosmic web.
Table 2 summarizes the number of critical points identified in the MGS of the SDSS for various persistence thresholds (3σ and 5σ) and levels of smoothing (no smoothing, single smoothing, and double smoothing). As the persistence threshold and smoothing level increase, the number of critical points detected decreases significantly. This behavior arises because higher persistence thresholds filter out less significant structures, while increased smoothing eliminates finer details, leaving only the most prominent features.
Number of filament vertices at redshifts of < 0.1 by persistence level.
Figure 7 illustrates the distribution of filaments identified by DisPerSE for the same persistence and smoothing parameters. The panels clearly demonstrate how these settings impact the complexity and prominence of the detected filamentary structures.
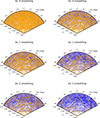 |
Fig. 7. Distribution of central galaxies (blue dots) and cosmic-web filaments (orange lines) in polar coordinates. The angular axis represents right ascension (RA), and the radial axis corresponds to redshift. Each of the six panels shows filaments extracted with different combinations of persistence threshold (3σ or 5σ) and smoothing level (0, 1, or 2) using DisPerSE. The underlying galaxy sample is identical across all panels to highlight the effect of varying DisPerSE parameters on filament detection. |
In the upper-left panel (3σ, no smoothing), the number of filaments is significantly higher, indicating the inclusion of many smaller and less prominent structures. This is a consequence of the low persistence threshold, which allows DisPerSE to detect a wide range of features, including noise and minor filaments. The absence of smoothing preserves fine details, resulting in a dense and intricate web-like structure.
As smoothing is increased (top-middle and top-right panels), the finer structures are progressively removed, leaving only the larger-scale filaments. This illustrates the effect of smoothing in simplifying the cosmic web by suppressing small-scale noise and enhancing the coherence of prominent features.
The bottom row (5σ) reflects the effect of a higher persistence threshold. Compared to the 3σ panels, the number of filaments decreases substantially as only statistically significant structures are retained. In the absence of smoothing (bottom-left panel), the detected filaments are less dense but still exhibit substantial complexity. As smoothing levels increase (bottom-middle and bottom-right panels), the filamentary network is further simplified, with only the most significant structures remaining. The bottom-right panel (5σ, 2 smoothing) represents the most simplified version of the cosmic web, where only the strongest and most coherent filaments are preserved.
This analysis highlights how DisPerSE’s parameters can be tuned to study different aspects of the cosmic web. Lower persistence thresholds and minimal smoothing are useful for exploring the detailed structure of the web, while higher thresholds and greater smoothing emphasize the most prominent and statistically significant features.
The analysis of Fig. 8 shows the HOD for two filament-associated environments, filaments and filament outskirts, as a function of the halo mass. The upper panels present the mean occupation number, ⟨N|Mh⟩, for the overall population (black line) and for specific combinations of persistence parameters (3σ and 5σ) and smoothing levels (0, 1, and 2).
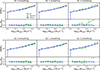 |
Fig. 8. HODs and corresponding ratios between environmental and global HODs for a magnitude cut of Mr < −20.0. We show the results using a DisPerSE persistence threshold of 3σ (top two rows) and 5σ (bottom two). Each column indicates a different smoothing level (0, 1, and 2). The top and fourth rows show the mean number of galaxies as a function of halo mass, ⟨N|Mh⟩, for all halos (black) and for those in filaments (yellow), filament outskirts (orange), and other regions (red). The second and fifth rows show the ratio of the environmental HODs to the global one, highlighting relative variations across halo masses and environments. |
In filaments, shown in the left panels, the HOD shows that, for a low persistence threshold (3σ), less prominent structures are identified, resulting in more scattered trends, particularly as the smoothing level increases. In contrast, for 5σ, the HOD becomes smoother and aligns more closely with the general trend, since only the most significant structures are considered. This behavior is consistent in the filament outskirts environment, where the differences between parameter configurations are similar.
The bottom panels show the HOD ratios for each configuration relative to the overall population. In both environments, the ratios remain close to unity, indicating that variations in persistence and smoothing have a limited impact on the average occupation for most halo mass bins. However, at 3σ, the ratios exhibit greater fluctuations, particularly in low-mass halos (Mh < 1012.5 M⊙ h−1), reflecting the inclusion of less prominent structures. At 5σ, the ratios are more stable, demonstrating that focusing on more significant structures yields more robust and consistent results.
In both environments, the main variations induced by different DisPerSE parameters are more evident at intermediate-to-high halo masses (1013–1013.5 M⊙ M⊙ h−1), while at the lowest halo masses the occupation ratios remain close to unity. At the very highest masses, the apparent fluctuations are mostly driven by finite statistics. This reinforces the idea that DisPerSE parameters allow the analysis of the cosmic web to be tailored, capturing small and detailed structures in low-persistence configurations and emphasizing the most prominent and stable structures in high-persistence and smoothing configurations.
As an additional robustness check, we also explored a more traditional environment definition based on the local galaxy number density within a fixed comoving radius of 5 h−1 Mpc around each central galaxy. We then divided the sample into terciles of this density field and compared the HODs of the highest- and lowest-density subsets, including separate analyses for red and blue centrals. Consistent with our main results, we find no significant differences between the density-selected subsamples, except for marginal deviations at the highest halo masses. This test reinforces the conclusion that halo mass is the primary driver of galaxy occupation, with only weak modulation by either large-scale cosmic web definitions or local density measures. We emphasize that our results should be interpreted within the limitations of our observational sample, which is subject to volume and completeness effects.
5. Discussion and conclusions
This work investigates how galaxies occupy dark matter halos across the cosmic web, focusing on the impact of different environments and galaxy properties on the HOD. Using observational data from the SDSS DR18, we relied on a publicly available group catalog in which galaxy groups, which are used as proxies for dark matter halos, have been identified, with assigned halo masses, group memberships, and unique identifiers (Rodriguez & Merchán 2020). To characterize the large-scale structure, we used an additional publicly available catalog based on the DisPerSE algorithm, which traces the cosmic web and identifies its critical points (Malavasi et al. 2020). We then examined how environmental classifications and intrinsic galaxy properties influence the HOD across distinct cosmic environments.
A key finding of our analysis is the ineffectiveness of simple distance-based environmental classifications – constructed from the DisPerSE critical points – in distinguishing HOD differences. This straightforward approach fails to capture the complex and overlapping nature of cosmic environments, such as the coexistence of filaments, voids, and clusters. In practice, what this method primarily reveals is the well-known tendency of galaxies to lie near clusters and avoid voids, rather than providing meaningful insight into how HOD varies with environment. As a result, separating galaxies into distinct environments is essential for a more informative analysis of HOD variations.
To improve upon simple distance-based classifications, our HOD analysis incorporated discrete environmental categories, including clusters, cluster outskirts, filaments, filament outskirts, and a broader category encompassing all other regions. Even with this more refined approach, no significant differences are observed across these environments, reinforcing the overall invariance of group occupation throughout the cosmic web. The only notable deviation is found for intermediate-mass groups, which appear to host 15–20% fewer luminous galaxies when located in filaments, although this difference remains within the uncertainties of the measurement. The stability of the HOD suggests that, within the limits of our analysis, the large-scale environment has little effect on halo occupation, especially when intrinsic galaxy properties are not accounted for. These results support the view that environmental effects on the HOD are subtle and may only become apparent in extreme environments and when the parameter space is expanded to include additional galaxy characteristics (e.g., Alfaro et al. 2020, 2021, 2022).
As expected, when galaxies are classified by color, clear differences emerge in the HODs. Red central galaxies consistently host significantly more satellite galaxies than blue central galaxies. Our analysis confirms this well-established trend across all environments and volumes (e.g., Zehavi et al. 2011; Peng et al. 2012; Wetzel et al. 2013; Campbell et al. 2015; Oxland et al. 2024). This result highlights the strong dependence of the HOD on the properties of the central galaxy, with galaxy color serving as a reliable indicator of satellite populations. Blue central galaxies, indicative of younger, actively star-forming systems, tend to host far fewer satellites than red central galaxies, which are more evolved and quiescent. Once again, slight deviations are mainly observed in filaments for the brightest galaxy samples, with our results suggesting that this effect may be relevant only for red galaxies. These subtle differences hint at the potential of combining environmental and intrinsic galaxy properties, especially with improving spectroscopic data in upcoming years.
We also verified that the characterization of filaments is highly sensitive to the choice of DisPerSE parameters. In particular, the smoothing scale has a significant impact on both the identification of filaments and the subsequent environmental classification of galaxies. While these variations have little effect on the resulting HODs across most environments, notable differences once again arise in filament regions, where satellite statistics can vary by up to 50% in certain mass ranges when the largest smoothing scale is adopted. Although still subtle, these variations warrant further investigation to better understand the connection between HOD and filamentary structure.
The consistency of the HOD that we measure observationally is in fairly good agreement with previous results, although some differences exist. Using the Illustris-TNG hydrodynamical simulations (Pillepich et al. 2018a,b; Springel et al. 2018) and DisPerSE, Perez et al. (2024) found that the HOD for halos in filaments was remarkably similar to that of the total galaxy sample, suggesting halo mass is the dominant factor in galaxy occupation. In the SDSS, Alfaro et al. (2022) discovered HOD variations but only in extreme environments, such as very under-dense voids and future virialized structures. Moving forward, it would be valuable to extend our analysis to lower masses, refine environmental classification schemes, and explore alternative cosmic web definitions.
A relevant connection with our results lies in the context of occupancy variations – the secondary dependences of the HOD on internal halo properties beyond halo mass. This effect is believed to be the cause, at least in part, of the halo assembly bias in the galaxy population (Zehavi et al. 2018). In this view, galaxy assembly bias may result from the underlying halo assembly bias combined with a dependence of halo occupancy on the same secondary halo property at fixed mass. Although such trends have been detected in hydrodynamical simulations with high statistical significance (Artale et al. 2018), a consensus from observational studies has yet to emerge, as current results yield conflicting conclusions (Yuan et al. 2021; Salcedo et al. 2022; Wang et al. 2022; Alam et al. 2024). At face value, the consistency of the HOD across the cosmic web in the SDSS, as reported in this work, does appear to leave little room for occupancy variations. It is reasonable to expect that the strongest secondary effect – beyond halo mass – would stem from the environment (which is indeed the case for large-scale bias; see, e.g., Musso et al. 2018; Borzyszkowski et al. 2017; Paranjape et al. 2018; Montero-Dorta & Rodriguez 2024). However, while our results may appear to be in slight tension with some recent forward-modeling analyses that incorporate assembly bias through decorated or extended HOD frameworks (e.g., Hadzhiyska et al. 2020; Xu et al. 2021; Yuan et al. 2021), the differing methodologies and definitions of environment make a direct comparison nontrivial. Given the observational limitations of our sample and the still uncertain status of an observational detection of galaxy assembly bias, for which no consensus has yet been reached, we remain cautious in drawing strong conclusions and regard a quantitative connection between these approaches as an important direction for future work.
This work is particularly timely, as new data from upcoming surveys, such as the Dark Energy Spectroscopic Instrument (DESI; DESI Collaboration 2016), Prime Focus Spectrograph (PFS; Tamura et al. 2016), Euclid (Laureijs et al. 2011), and the Vera C. Rubin Observatory (Ivezić et al. 2019), will soon become available. These data will enable a more comprehensive understanding of how galaxies and groups interact with the cosmic web and its underlying structures.
Acknowledgments
FR thanks the support by Agencia Nacional de Promoción Científica y Tecnológica, the Consejo Nacional de Investigaciones Científicas y Técnicas (CONICET, Argentina) and the Secretaría de Ciencia y Tecnología de la Universidad Nacional de Córdoba (SeCyT-UNC, Argentina). ADMD acknowledges support from the Universidad Técnica Federico Santa María through the Proyecto Interno Regular PI_LIR_25_04. FR and ADMD thank the ICTP for their hospitality and financial support through the Junior Associates Programme 2023–2028 and Regular Associates Programme 2022–2027, respectively. VID acknowledges the support from the Dirección de Postgrado of Universidad Técnica Federico Santa María through the Master’s scholarship programme.
References
- Alam, S., Paranjape, A., & Peacock, J. A. 2024, MNRAS, 527, 3771 [Google Scholar]
- Alfaro, I. G., Rodriguez, F., Ruiz, A. N., & Lambas, D. G. 2020, A&A, 638, A60 [NASA ADS] [CrossRef] [EDP Sciences] [Google Scholar]
- Alfaro, I. G., Ruiz, A. N., Luparello, H. E., Rodriguez, F., & Garcia Lambas, D. 2021, A&A, 654, A62 [NASA ADS] [CrossRef] [EDP Sciences] [Google Scholar]
- Alfaro, I. G., Rodriguez, F., Ruiz, A. N., Luparello, H. E., & Lambas, D. G. 2022, A&A, 665, A44 [NASA ADS] [CrossRef] [EDP Sciences] [Google Scholar]
- Alfaro, I. G., Rodriguez, F., & Ruiz, A. N. 2025, A&A, 700, A159 [NASA ADS] [CrossRef] [EDP Sciences] [Google Scholar]
- Almeida, A., Anderson, S. F., Argudo-Fernández, M., et al. 2023, ApJS, 267, 44 [NASA ADS] [CrossRef] [Google Scholar]
- Aragón-Calvo, M. A., van de Weygaert, R., & Jones, B. J. T. 2010, MNRAS, 408, 2163 [CrossRef] [Google Scholar]
- Artale, M. C., Zehavi, I., Contreras, S., & Norberg, P. 2018, MNRAS, 480, 3978 [NASA ADS] [CrossRef] [Google Scholar]
- Avila, S., Gonzalez-Perez, V., Mohammad, F. G., et al. 2020, MNRAS, 499, 5486 [NASA ADS] [CrossRef] [Google Scholar]
- Balaguera-Antolínez, A., Montero-Dorta, A. D., & Favole, G. 2024, A&A, 685, A61 [NASA ADS] [CrossRef] [EDP Sciences] [Google Scholar]
- Baugh, C. M. 2006, Rep. Prog. Phys., 69, 3101 [NASA ADS] [CrossRef] [Google Scholar]
- Behroozi, P. S., Conroy, C., & Wechsler, R. H. 2010, ApJ, 717, 379 [Google Scholar]
- Behroozi, P., Wechsler, R. H., Hearin, A. P., & Conroy, C. 2019, MNRAS, 488, 3143 [NASA ADS] [CrossRef] [Google Scholar]
- Berlind, A. A., & Weinberg, D. H. 2002, ApJ, 575, 587 [Google Scholar]
- Bond, J. R., Kofman, L., & Pogosyan, D. 1996, Nature, 380, 603 [NASA ADS] [CrossRef] [Google Scholar]
- Borzyszkowski, M., Porciani, C., Romano-Díaz, E., & Garaldi, E. 2017, MNRAS, 469, 594 [NASA ADS] [CrossRef] [Google Scholar]
- Campbell, D., van den Bosch, F. C., Hearin, A., et al. 2015, MNRAS, 452, 444 [NASA ADS] [CrossRef] [Google Scholar]
- Cautun, M., van de Weygaert, R., Jones, B. J. T., & Frenk, C. S. 2014, MNRAS, 441, 2923 [Google Scholar]
- Ceccarelli, L., Paz, D., Lares, M., Padilla, N., & Lambas, D. G. 2013, MNRAS, 434, 1435 [NASA ADS] [CrossRef] [Google Scholar]
- Contreras, S., & Zehavi, I. 2023, MNRAS, 525, 4257 [Google Scholar]
- Contreras, S., Zehavi, I., Baugh, C. M., Padilla, N., & Norberg, P. 2017, MNRAS, 465, 2833 [NASA ADS] [CrossRef] [Google Scholar]
- Contreras, S., Zehavi, I., Padilla, N., et al. 2019, MNRAS, 484, 1133 [NASA ADS] [CrossRef] [Google Scholar]
- Contreras, S., Chaves-Montero, J., Zennaro, M., & Angulo, R. E. 2021, MNRAS, 507, 3412 [NASA ADS] [CrossRef] [Google Scholar]
- Cooray, A., & Sheth, R. 2002, Phys. Rep., 372, 1 [Google Scholar]
- Dalal, N., White, M., Bond, J. R., & Shirokov, A. 2008, ApJ, 687, 12 [NASA ADS] [CrossRef] [Google Scholar]
- Dekel, A., Birnboim, Y., Engel, G., et al. 2009, Nature, 457, 451 [Google Scholar]
- DESI Collaboration (Aghamousa, A., et al.) 2016, arXiv e-prints [arXiv:1611.00036] [Google Scholar]
- Galárraga-Espinosa, D., Garaldi, E., & Kauffmann, G. 2023, A&A, 671, A160 [NASA ADS] [CrossRef] [EDP Sciences] [Google Scholar]
- Gao, L., Springel, V., & White, S. D. M. 2005, MNRAS, 363, L66 [NASA ADS] [CrossRef] [Google Scholar]
- Gonzalez, E. J., Rodriguez, F., Merchán, M., et al. 2021, MNRAS, 504, 4093 [NASA ADS] [CrossRef] [Google Scholar]
- Hadzhiyska, B., Alonso, D., Nicola, A., & Slosar, A. 2020, JCAP, 10, 056 [Google Scholar]
- Hahn, O., Porciani, C., Carollo, C. M., & Dekel, A. 2007, MNRAS, 375, 489 [NASA ADS] [CrossRef] [Google Scholar]
- Hamaus, N., Wandelt, B. D., Sutter, P. M., Lavaux, G., & Warren, M. S. 2014, Phys. Rev. Lett., 112, 041304 [NASA ADS] [CrossRef] [Google Scholar]
- Hopkins, P. F., Hernquist, L., Cox, T. J., & Kereš, D. 2008, ApJS, 175, 356 [Google Scholar]
- Huchra, J. P., & Geller, M. J. 1982, ApJ, 257, 423 [NASA ADS] [CrossRef] [Google Scholar]
- Ivezić, Ž., Kahn, S. M., Tyson, J. A., et al. 2019, ApJ, 873, 111 [Google Scholar]
- Kim, Y., Montero-Dorta, A. D., Smith, R., & Shinn, J.-H. 2025, A&A, 700, A149 [NASA ADS] [CrossRef] [EDP Sciences] [Google Scholar]
- Kraljic, K., Arnouts, S., Pichon, C., et al. 2018, MNRAS, 474, 547 [Google Scholar]
- Kravtsov, A. V., Berlind, A. A., Wechsler, R. H., et al. 2004, ApJ, 609, 35 [Google Scholar]
- Lacey, C., & Cole, S. 1994, MNRAS, 271, 676 [Google Scholar]
- Laureijs, R., Amiaux, J., Arduini, S., et al. 2011, arXiv e-prints [arXiv:1110.3193] [Google Scholar]
- Libeskind, N. I., van de Weygaert, R., Cautun, M., et al. 2017, MNRAS, 473, 1195 [Google Scholar]
- Malavasi, N., Arnouts, S., Vibert, D., et al. 2016, MNRAS, 465, 3817 [Google Scholar]
- Malavasi, N., Pozzetti, L., Cucciati, O., et al. 2017, MNRAS, 470, 1274 [NASA ADS] [CrossRef] [Google Scholar]
- Malavasi, N., Aghanim, N., Douspis, M., Tanimura, H., & Bonjean, V. 2020, A&A, 642, A19 [NASA ADS] [CrossRef] [EDP Sciences] [Google Scholar]
- Maraston, C., Strömbäck, G., Thomas, D., Wake, D. A., & Nichol, R. C. 2009, MNRAS, 394, L107 [NASA ADS] [CrossRef] [Google Scholar]
- McCracken, H. J., Wolk, M., Colombi, S., et al. 2015, MNRAS, 449, 901 [NASA ADS] [CrossRef] [Google Scholar]
- Merchán, M. E., & Zandivarez, A. 2005, ApJ, 630, 759 [CrossRef] [Google Scholar]
- Montero-Dorta, A. D., & Rodriguez, F. 2024, MNRAS, 531, 290 [NASA ADS] [CrossRef] [Google Scholar]
- Montero-Dorta, A. D., Artale, M. C., Abramo, L. R., et al. 2020, MNRAS, 496, 1182 [NASA ADS] [CrossRef] [Google Scholar]
- Montero-Dorta, A. D., Chaves-Montero, J., Artale, M. C., & Favole, G. 2021, MNRAS, 508, 940 [NASA ADS] [CrossRef] [Google Scholar]
- Montero-Dorta, A. D., Contreras, S., Artale, M. Celeste, Rodriguez, F., & Favole, G. 2025, A&A, 695, A159 [NASA ADS] [CrossRef] [EDP Sciences] [Google Scholar]
- Musso, M., Cadiou, C., Pichon, C., et al. 2018, MNRAS, 476, 4877 [Google Scholar]
- Naab, T., & Ostriker, J. P. 2017, ARA&A, 55, 59 [Google Scholar]
- Oxland, M., Parker, L. C., de Carvalho, R. R., & Sampaio, V. M. 2024, MNRAS, 529, 3651 [NASA ADS] [CrossRef] [Google Scholar]
- Paranjape, A., Hahn, O., & Sheth, R. K. 2018, MNRAS, 476, 3631 [NASA ADS] [CrossRef] [Google Scholar]
- Peng, Y.-J., Lilly, S. J., Renzini, A., & Carollo, M. 2012, ApJ, 757, 4 [NASA ADS] [CrossRef] [Google Scholar]
- Perez, N. R., Pereyra, L. A., Coldwell, G., et al. 2024, MNRAS, 528, 3186 [Google Scholar]
- Pillepich, A., Nelson, D., Hernquist, L., et al. 2018a, MNRAS, 475, 648 [Google Scholar]
- Pillepich, A., Springel, V., Nelson, D., et al. 2018b, MNRAS, 473, 4077 [Google Scholar]
- Planck Collaboration XXVII. 2016, A&A, 594, A27 [NASA ADS] [CrossRef] [EDP Sciences] [Google Scholar]
- Pollina, G., Hamaus, N., Dolag, K., et al. 2017, MNRAS, 469, 787 [NASA ADS] [CrossRef] [Google Scholar]
- Ramakrishnan, S., & Paranjape, A. 2020, MNRAS, 499, 4418 [Google Scholar]
- Ramakrishnan, S., Paranjape, A., Hahn, O., & Sheth, R. K. 2019, MNRAS, 489, 2977 [NASA ADS] [CrossRef] [Google Scholar]
- Ricciardelli, E., Cava, A., Varela, J., & Quilis, V. 2014, MNRAS, 445, 4045 [NASA ADS] [CrossRef] [Google Scholar]
- Rodriguez, F., & Merchán, M. 2020, A&A, 636, A61 [NASA ADS] [CrossRef] [EDP Sciences] [Google Scholar]
- Rodriguez, F., Merchán, M., & Artale, M. C. 2022, MNRAS, 514, 1077 [NASA ADS] [CrossRef] [Google Scholar]
- Rodriguez, F., Merchán, M., Galárraga-Espinosa, D., et al. 2025, A&A, 699, A215 [NASA ADS] [CrossRef] [EDP Sciences] [Google Scholar]
- Rodríguez-Medrano, A. M., Paz, D. J., Stasyszyn, F. A., et al. 2023, MNRAS, 521, 916 [CrossRef] [Google Scholar]
- Salcedo, A. N., Wibking, B. D., Weinberg, D. H., et al. 2020, MNRAS, 491, 3061 [Google Scholar]
- Salcedo, A. N., Zu, Y., Zhang, Y., et al. 2022, Sci. China Phys. Mech. Astron, 65, 109811 [Google Scholar]
- Sato-Polito, G., Montero-Dorta, A. D., Abramo, L. R., Prada, F., & Klypin, A. 2019, MNRAS, 487, 1570 [NASA ADS] [CrossRef] [Google Scholar]
- Schaap, W. E., & van de Weygaert, R. 2000, A&A, accepted [arXiv:astro-ph/0011007] [Google Scholar]
- Sheth, R. K., & Tormen, G. 2004, MNRAS, 350, 1385 [NASA ADS] [CrossRef] [Google Scholar]
- Somerville, R. S., & Davé, R. 2015, ARA&A, 53, 51 [Google Scholar]
- Sousbie, T. 2011, MNRAS, 414, 350 [NASA ADS] [CrossRef] [Google Scholar]
- Sousbie, T., Pichon, C., & Kawahara, H. 2011, MNRAS, 414, 384 [NASA ADS] [CrossRef] [Google Scholar]
- Springel, V., White, S. D. M., Jenkins, A., et al. 2005, Nature, 435, 629 [Google Scholar]
- Springel, V., Pakmor, R., Pillepich, A., et al. 2018, MNRAS, 475, 676 [Google Scholar]
- Strauss, M. A., Weinberg, D. H., Lupton, R. H., et al. 2002, AJ, 124, 1810 [Google Scholar]
- Tamura, N., Takato, N., Shimono, A., et al. 2016, Proc. SPIE, 9908, 99081M [NASA ADS] [CrossRef] [Google Scholar]
- Tempel, E., Stoica, R. S., Martínez, V. J., et al. 2014, MNRAS, 438, 3465 [CrossRef] [Google Scholar]
- Tinker, J. L., & Conroy, C. 2009, ApJ, 691, 633 [Google Scholar]
- Tinker, J. L., Weinberg, D. H., & Warren, M. S. 2006, ApJ, 647, 737 [NASA ADS] [CrossRef] [Google Scholar]
- Tinker, J., Kravtsov, A. V., Klypin, A., et al. 2008, ApJ, 688, 709 [Google Scholar]
- Tucci, B., Montero-Dorta, A. D., Abramo, L. R., Sato-Polito, G., & Artale, M. C. 2021, MNRAS, 500, 2777 [Google Scholar]
- Vale, A., & Ostriker, J. P. 2004, MNRAS, 353, 189 [Google Scholar]
- van de Weygaert, R., & Schaap, W. 2009, in Data Analysis in Cosmology, eds. V. J. Martínez, E. Saar, E. Martínez-González, & M. J. Pons-Bordería, 665, 291 [NASA ADS] [CrossRef] [Google Scholar]
- van den Bosch, F. C., More, S., Cacciato, M., Mo, H., & Yang, X. 2013, MNRAS, 430, 725 [NASA ADS] [CrossRef] [Google Scholar]
- Wang, K., Mao, Y.-Y., Zentner, A. R., et al. 2022, MNRAS, 516, 4003 [Google Scholar]
- Wechsler, R. H., & Tinker, J. L. 2018, ARA&A, 56, 435 [NASA ADS] [CrossRef] [Google Scholar]
- Wetzel, A. R., Tinker, J. L., Conroy, C., & van den Bosch, F. C. 2013, MNRAS, 432, 336 [Google Scholar]
- White, S. D. M., & Rees, M. J. 1978, MNRAS, 183, 341 [Google Scholar]
- Xu, X., Kumar, S., Zehavi, I., & Contreras, S. 2021, MNRAS, 507, 4879 [CrossRef] [Google Scholar]
- Yang, X., Mo, H. J., van den Bosch, F. C., et al. 2007, ApJ, 671, 153 [Google Scholar]
- York, D. G., Adelman, J., Anderson, J. E., Jr, et al. 2000, AJ, 120, 1579 [Google Scholar]
- Yuan, S., Garrison, L. H., Hadzhiyska, B., Bose, S., & Eisenstein, D. J. 2021, MNRAS, 510, 3301 [Google Scholar]
- Zehavi, I., Zheng, Z., Weinberg, D. H., et al. 2011, ApJ, 736, 59 [NASA ADS] [CrossRef] [Google Scholar]
- Zehavi, I., Contreras, S., Padilla, N., et al. 2018, ApJ, 853, 84 [NASA ADS] [CrossRef] [Google Scholar]
- Zentner, A. R., Hearin, A. P., & van den Bosch, F. C. 2014, MNRAS, 443, 3044 [NASA ADS] [CrossRef] [Google Scholar]
- Zheng, Z., Berlind, A. A., Weinberg, D. H., et al. 2005, ApJ, 633, 791 [NASA ADS] [CrossRef] [Google Scholar]
This effect, which has only been measured in numerical simulations, refers to the dependence of halo clustering or bias on halo accretion history and related quantities, at fixed halo mass.
All Tables
All Figures
|
Fig. 1. Galaxy and critical point distribution in a ±75 Mpc redshift slice centered on the Coma cluster. Gray points are central galaxies from the SDSS MGS sample. Large circles are DisPerSE critical points color-coded by type (nodes, voids, and saddles). A single smoothing of the density field was applied before structure identification. |
| In the text | |
|
Fig. 2. Three-dimensional visualization of the five cosmic environments used in our analysis: galaxy clusters (red), cluster outskirts (blue), filaments (yellow), filaments outskirts (brown). Groups are shown as transparent magenta spheres, with radii equal to 3 times the R200 of each halo. Galaxies classified as filaments lie within 1 h−1 Mpc of the filament axis, while those in filament outskirts lie between 1 and 2 h−1 Mpc. This figure was generated using our SDSS DR18 dataset and environment classification scheme. |
| In the text | |
|
Fig. 3. HODs as a function of halo mass for groups at different proximity thresholds. Upper panels: HODs for subsamples within 25% (cyan), 15% (orange), and 5% (violet) of the nearest global maxima (left), global minima (center), and DisPerSE skeleton (right), compared to the complete sample (dashed black line). Lower panels: Ratios of each sample HOD to the complete sample HOD. The larger fluctuations at high masses reflect the smaller number of halos in these regimes. Error bars represent jackknife uncertainties estimated using 100 spatial subsamples. All results correspond to the absolute magnitude cut Mr < −20.0. |
| In the text | |
|
Fig. 4. HODs across cosmic environments for magnitude-limited samples (Mr < −19.76, −20.0, −20.5, and −21.0). Top panels: Mean occupation number versus halo mass for the overall sample (black line) compared to individual environments: clusters (pink), cluster outskirts (red), filaments (green), filament outskirts (yellow), and others (blue). Bottom panels: Ratio of each environment’s HOD to the overall sample. Error bars indicate jackknife uncertainties from 100 spatial subsamples. |
| In the text | |
|
Fig. 5. HODs segregated by galaxy color and environment. Top row: HODs (left) and their corresponding ratios (right) for red central galaxies ((g − r) > 0.83). Bottom row: Equivalent analysis for blue centrals ((g − r)≤0.83). Each column represents a different magnitude cut (Mr < −19.76, −20.0, −20.5, and −21.0). Solid black lines show the complete sample (“all”), while colored symbols represent environmental subsamples (clusters, cluster outskirts, filaments, filament outskirts, and others). Ratio panels compare each environment’s HOD to the corresponding color-classified complete sample (all red or all blue). |
| In the text | |
|
Fig. 6. Red-to-blue galaxy ratio (Nred/Nblue) as a function of halo mass (log10(Mhalo/[M⊙h−1]) for different galactic environments (color-coded) and four magnitude cuts (panels). The ratio increases systematically with halo mass in all environments, with the steepest growth occurring in the densest regions (clusters > cluster outskirts > filaments > filament outskirts > field). This mass- and density-dependent trend persists consistently across all magnitude cuts. Error bars show propagated uncertainties from jackknife-estimated HOD errors. |
| In the text | |
|
Fig. 7. Distribution of central galaxies (blue dots) and cosmic-web filaments (orange lines) in polar coordinates. The angular axis represents right ascension (RA), and the radial axis corresponds to redshift. Each of the six panels shows filaments extracted with different combinations of persistence threshold (3σ or 5σ) and smoothing level (0, 1, or 2) using DisPerSE. The underlying galaxy sample is identical across all panels to highlight the effect of varying DisPerSE parameters on filament detection. |
| In the text | |
|
Fig. 8. HODs and corresponding ratios between environmental and global HODs for a magnitude cut of Mr < −20.0. We show the results using a DisPerSE persistence threshold of 3σ (top two rows) and 5σ (bottom two). Each column indicates a different smoothing level (0, 1, and 2). The top and fourth rows show the mean number of galaxies as a function of halo mass, ⟨N|Mh⟩, for all halos (black) and for those in filaments (yellow), filament outskirts (orange), and other regions (red). The second and fifth rows show the ratio of the environmental HODs to the global one, highlighting relative variations across halo masses and environments. |
| In the text | |
Current usage metrics show cumulative count of Article Views (full-text article views including HTML views, PDF and ePub downloads, according to the available data) and Abstracts Views on Vision4Press platform.
Data correspond to usage on the plateform after 2015. The current usage metrics is available 48-96 hours after online publication and is updated daily on week days.
Initial download of the metrics may take a while.