Fig. 5.
Download original image
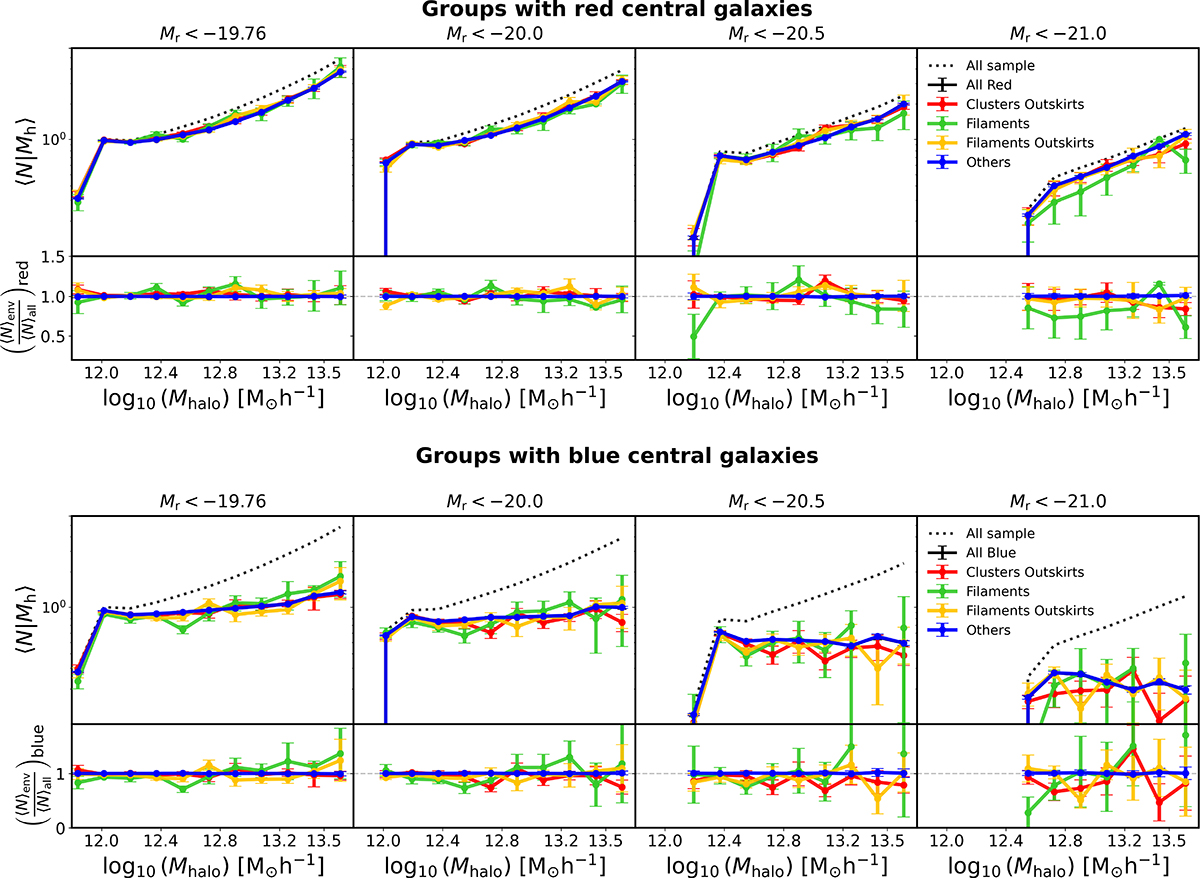
HODs segregated by galaxy color and environment. Top row: HODs (left) and their corresponding ratios (right) for red central galaxies ((g − r) > 0.83). Bottom row: Equivalent analysis for blue centrals ((g − r)≤0.83). Each column represents a different magnitude cut (Mr < −19.76, −20.0, −20.5, and −21.0). Solid black lines show the complete sample (“all”), while colored symbols represent environmental subsamples (clusters, cluster outskirts, filaments, filament outskirts, and others). Ratio panels compare each environment’s HOD to the corresponding color-classified complete sample (all red or all blue).
Current usage metrics show cumulative count of Article Views (full-text article views including HTML views, PDF and ePub downloads, according to the available data) and Abstracts Views on Vision4Press platform.
Data correspond to usage on the plateform after 2015. The current usage metrics is available 48-96 hours after online publication and is updated daily on week days.
Initial download of the metrics may take a while.