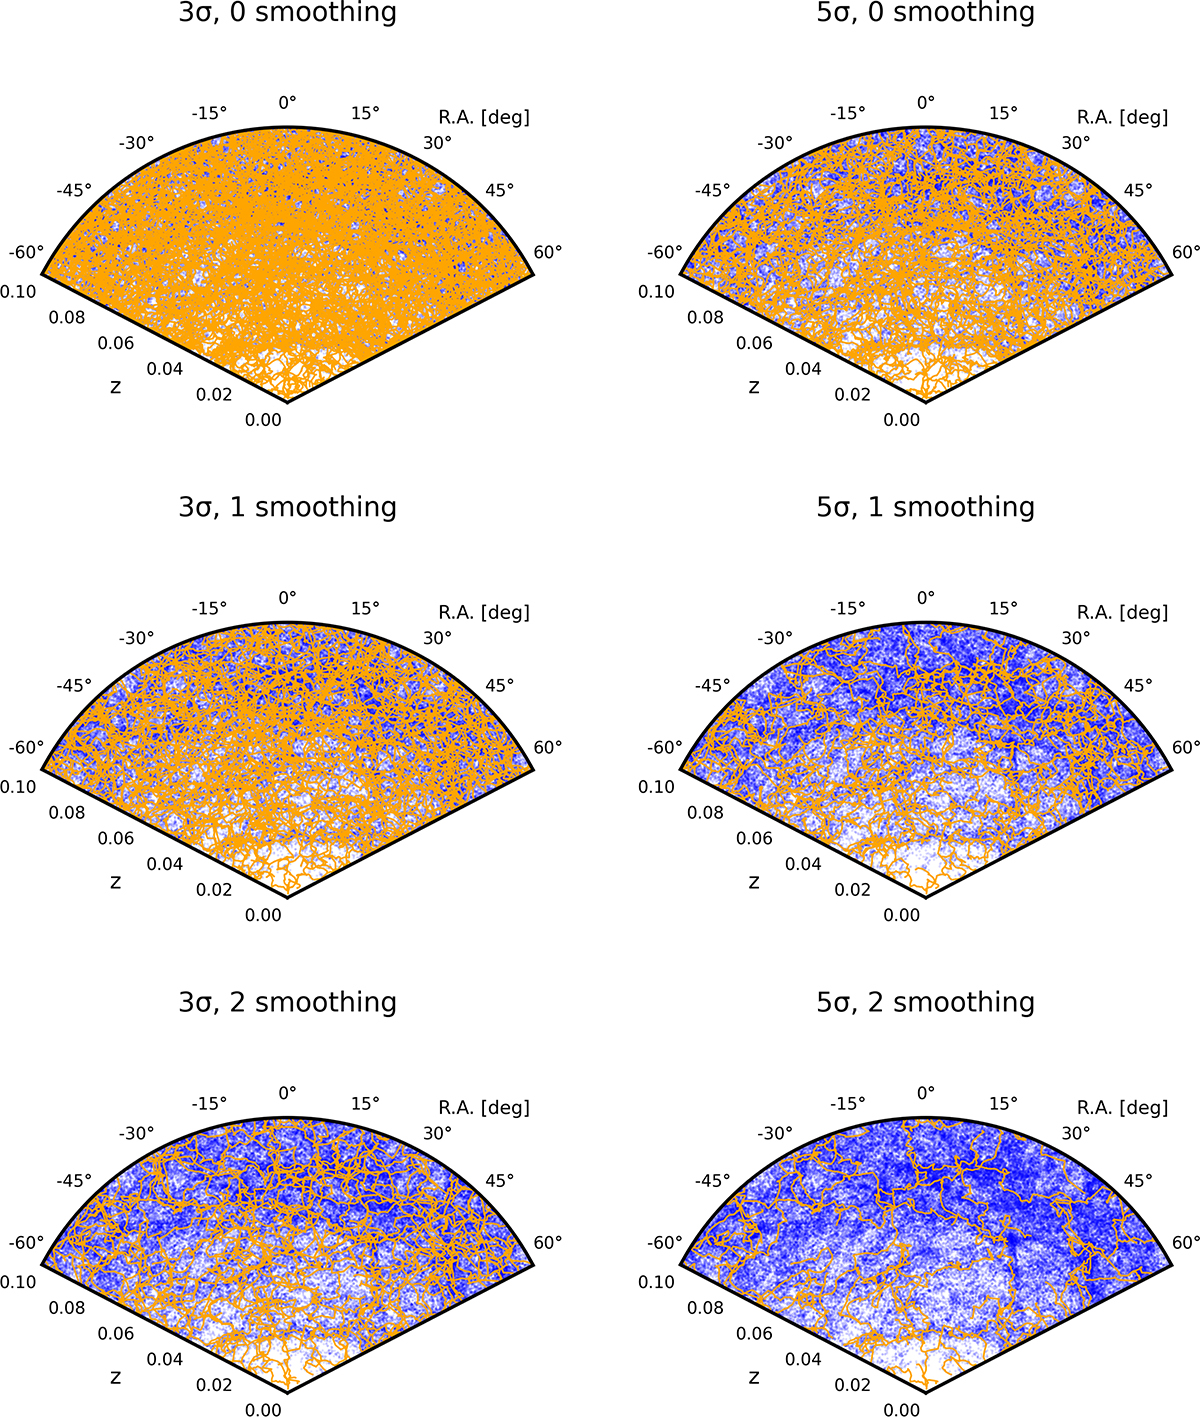
Fig. 7.
Download original image
Distribution of central galaxies (blue dots) and cosmic-web filaments (orange lines) in polar coordinates. The angular axis represents right ascension (RA), and the radial axis corresponds to redshift. Each of the six panels shows filaments extracted with different combinations of persistence threshold (3σ or 5σ) and smoothing level (0, 1, or 2) using DisPerSE. The underlying galaxy sample is identical across all panels to highlight the effect of varying DisPerSE parameters on filament detection.
Current usage metrics show cumulative count of Article Views (full-text article views including HTML views, PDF and ePub downloads, according to the available data) and Abstracts Views on Vision4Press platform.
Data correspond to usage on the plateform after 2015. The current usage metrics is available 48-96 hours after online publication and is updated daily on week days.
Initial download of the metrics may take a while.