Fig. 8.
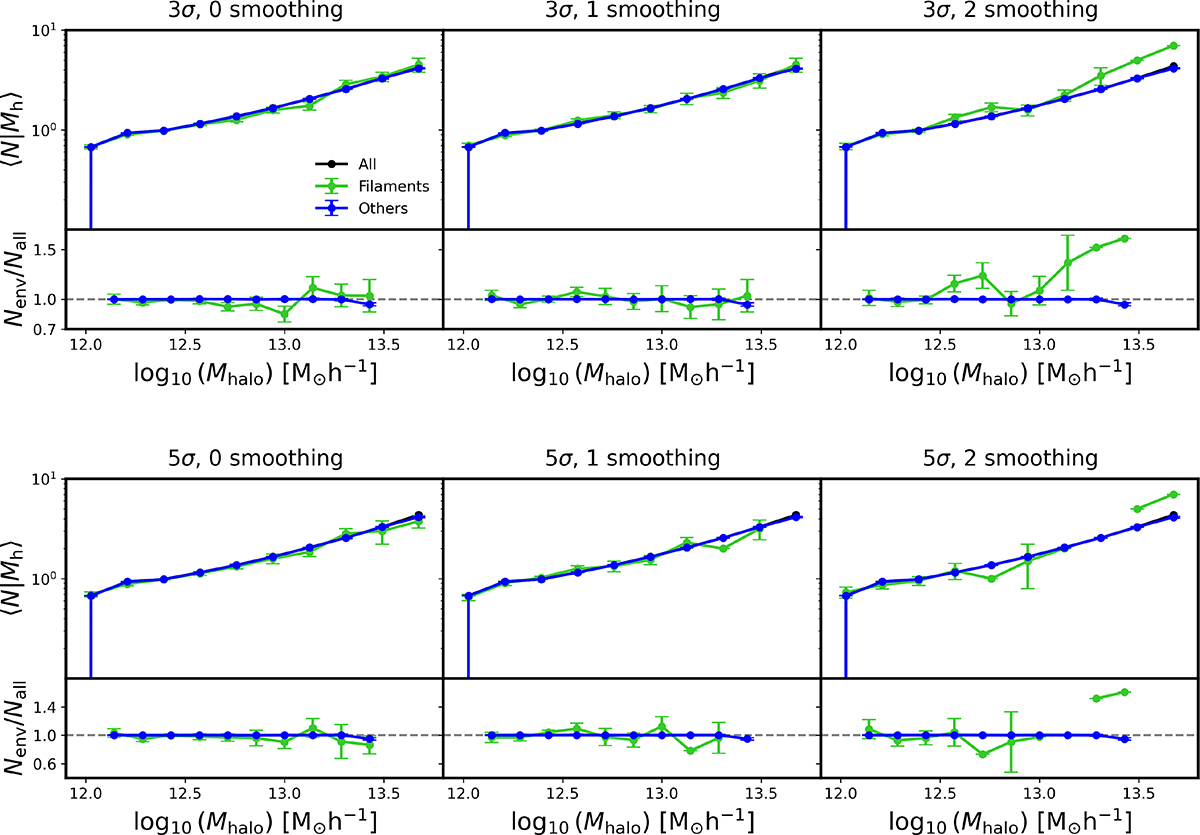
Download original image
HODs and corresponding ratios between environmental and global HODs for a magnitude cut of Mr < −20.0. We show the results using a DisPerSE persistence threshold of 3σ (top two rows) and 5σ (bottom two). Each column indicates a different smoothing level (0, 1, and 2). The top and fourth rows show the mean number of galaxies as a function of halo mass, ⟨N|Mh⟩, for all halos (black) and for those in filaments (yellow), filament outskirts (orange), and other regions (red). The second and fifth rows show the ratio of the environmental HODs to the global one, highlighting relative variations across halo masses and environments.
Current usage metrics show cumulative count of Article Views (full-text article views including HTML views, PDF and ePub downloads, according to the available data) and Abstracts Views on Vision4Press platform.
Data correspond to usage on the plateform after 2015. The current usage metrics is available 48-96 hours after online publication and is updated daily on week days.
Initial download of the metrics may take a while.