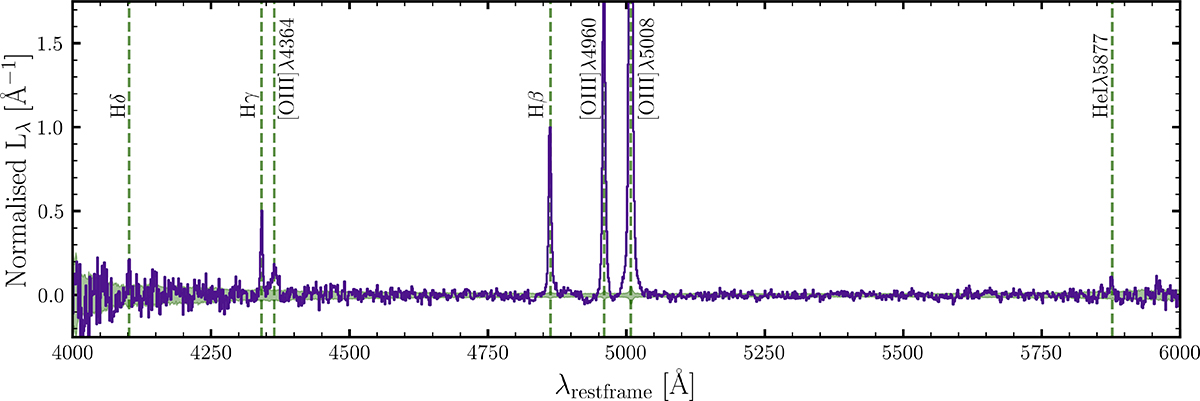
Fig. 2.
Download original image
Median stacked 1D rest-frame emission-line spectrum of the full sample of 792 [O III] emitters at z = 5.5–7. Each galaxy spectrum has been normalised by its ([O III]λ5008+2.98[O III]λ4960)/2 flux before stacking. The shaded green region shows the uncertainty estimated through bootstrap resampling. We highlight the wavelengths of Hδ, Hγ, [O III]λ4364, Hβ, [O III]λλ4960, 5008, and HeIλ5877. For visualisation, we normalised the stacked spectrum by the Hβ luminosity such that Hβ peaks at unity.
Current usage metrics show cumulative count of Article Views (full-text article views including HTML views, PDF and ePub downloads, according to the available data) and Abstracts Views on Vision4Press platform.
Data correspond to usage on the plateform after 2015. The current usage metrics is available 48-96 hours after online publication and is updated daily on week days.
Initial download of the metrics may take a while.