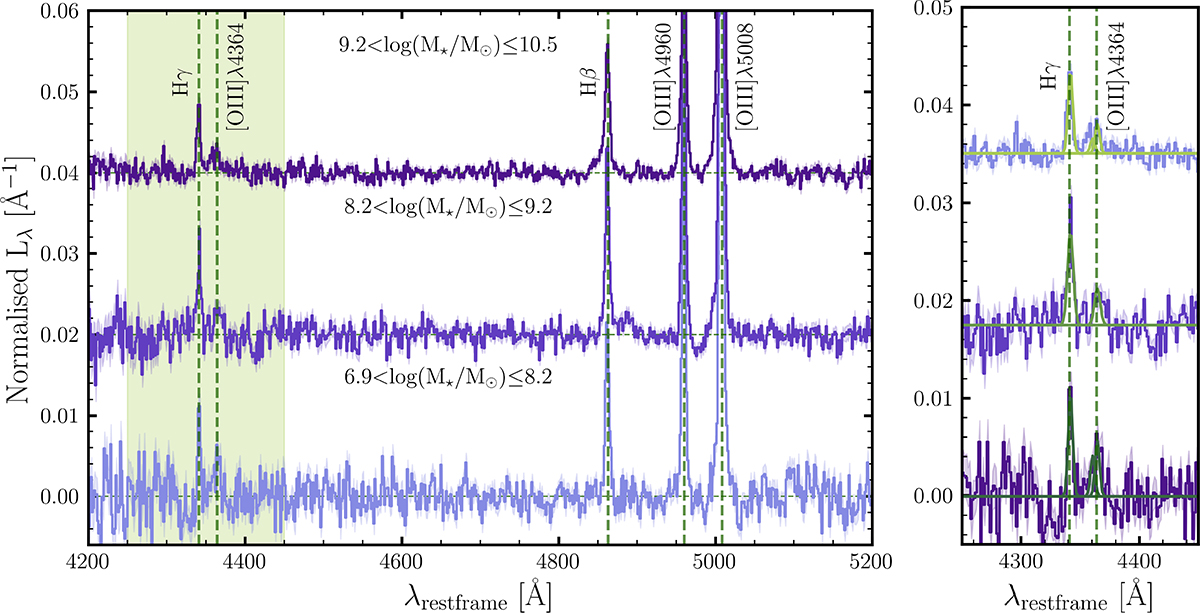
Fig. 3.
Download original image
Median stacked 1D rest-frame emission-line spectra of the Hγ sample (z = 6.3–7), in three stellar mass bins offset for visualisation purposes. The shaded region shows the uncertainty estimated through bootstrap resampling. In the right panel, we zoom into the wavelength range containing Hγ and [O III]λ4364. We fitted a complex of three Gaussians with the same standard deviation to obtain the fluxes of Hγ and [O III]λ4364. An additional Gaussian component was fitted to account for possible contamination by [Fe II]λ4360.
Current usage metrics show cumulative count of Article Views (full-text article views including HTML views, PDF and ePub downloads, according to the available data) and Abstracts Views on Vision4Press platform.
Data correspond to usage on the plateform after 2015. The current usage metrics is available 48-96 hours after online publication and is updated daily on week days.
Initial download of the metrics may take a while.