Fig. 5.
Download original image
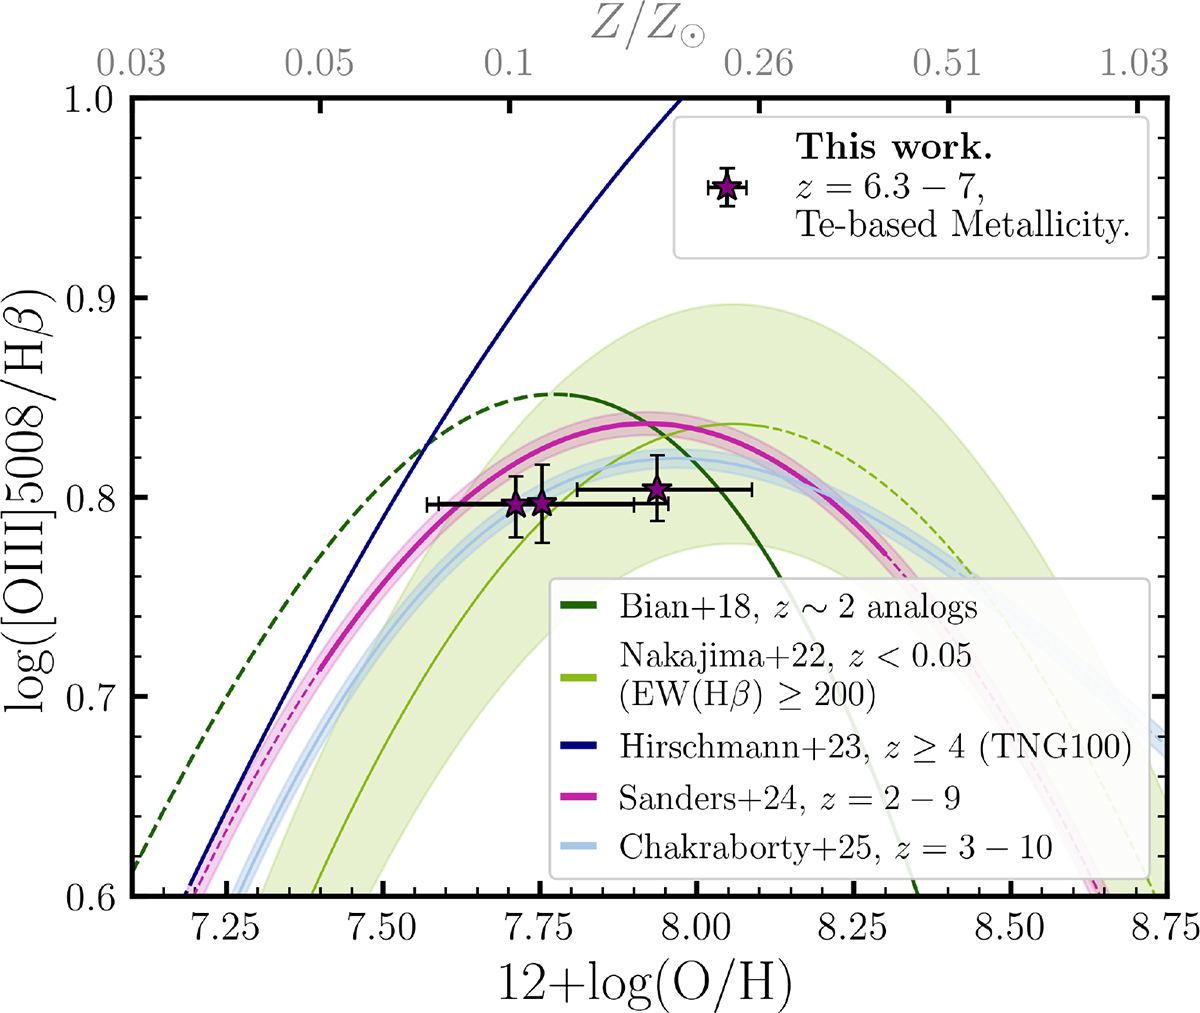
Relation between the gas-phase metallicity measured using the direct Te−method and the R3 ratio. We compare our estimates with several strong-line metallicity calibrations from literature. We show the calibration by Bian et al. (2018), which uses local analogues that occupy similar regions to z ∼ 2 star-forming galaxies on the BPT diagram, the calibration based on local galaxies with EW(Hβ) ≥ 200 derived by Nakajima et al. (2022), Hirschmann et al. (2023) calibration for z > 4 galaxies from the TNG100 simulation, and Sanders et al. (2024) and Chakraborty et al. (2025) calibrations for high-z galaxies between 2 < z < 10.
Current usage metrics show cumulative count of Article Views (full-text article views including HTML views, PDF and ePub downloads, according to the available data) and Abstracts Views on Vision4Press platform.
Data correspond to usage on the plateform after 2015. The current usage metrics is available 48-96 hours after online publication and is updated daily on week days.
Initial download of the metrics may take a while.