Fig. 4
Download original image
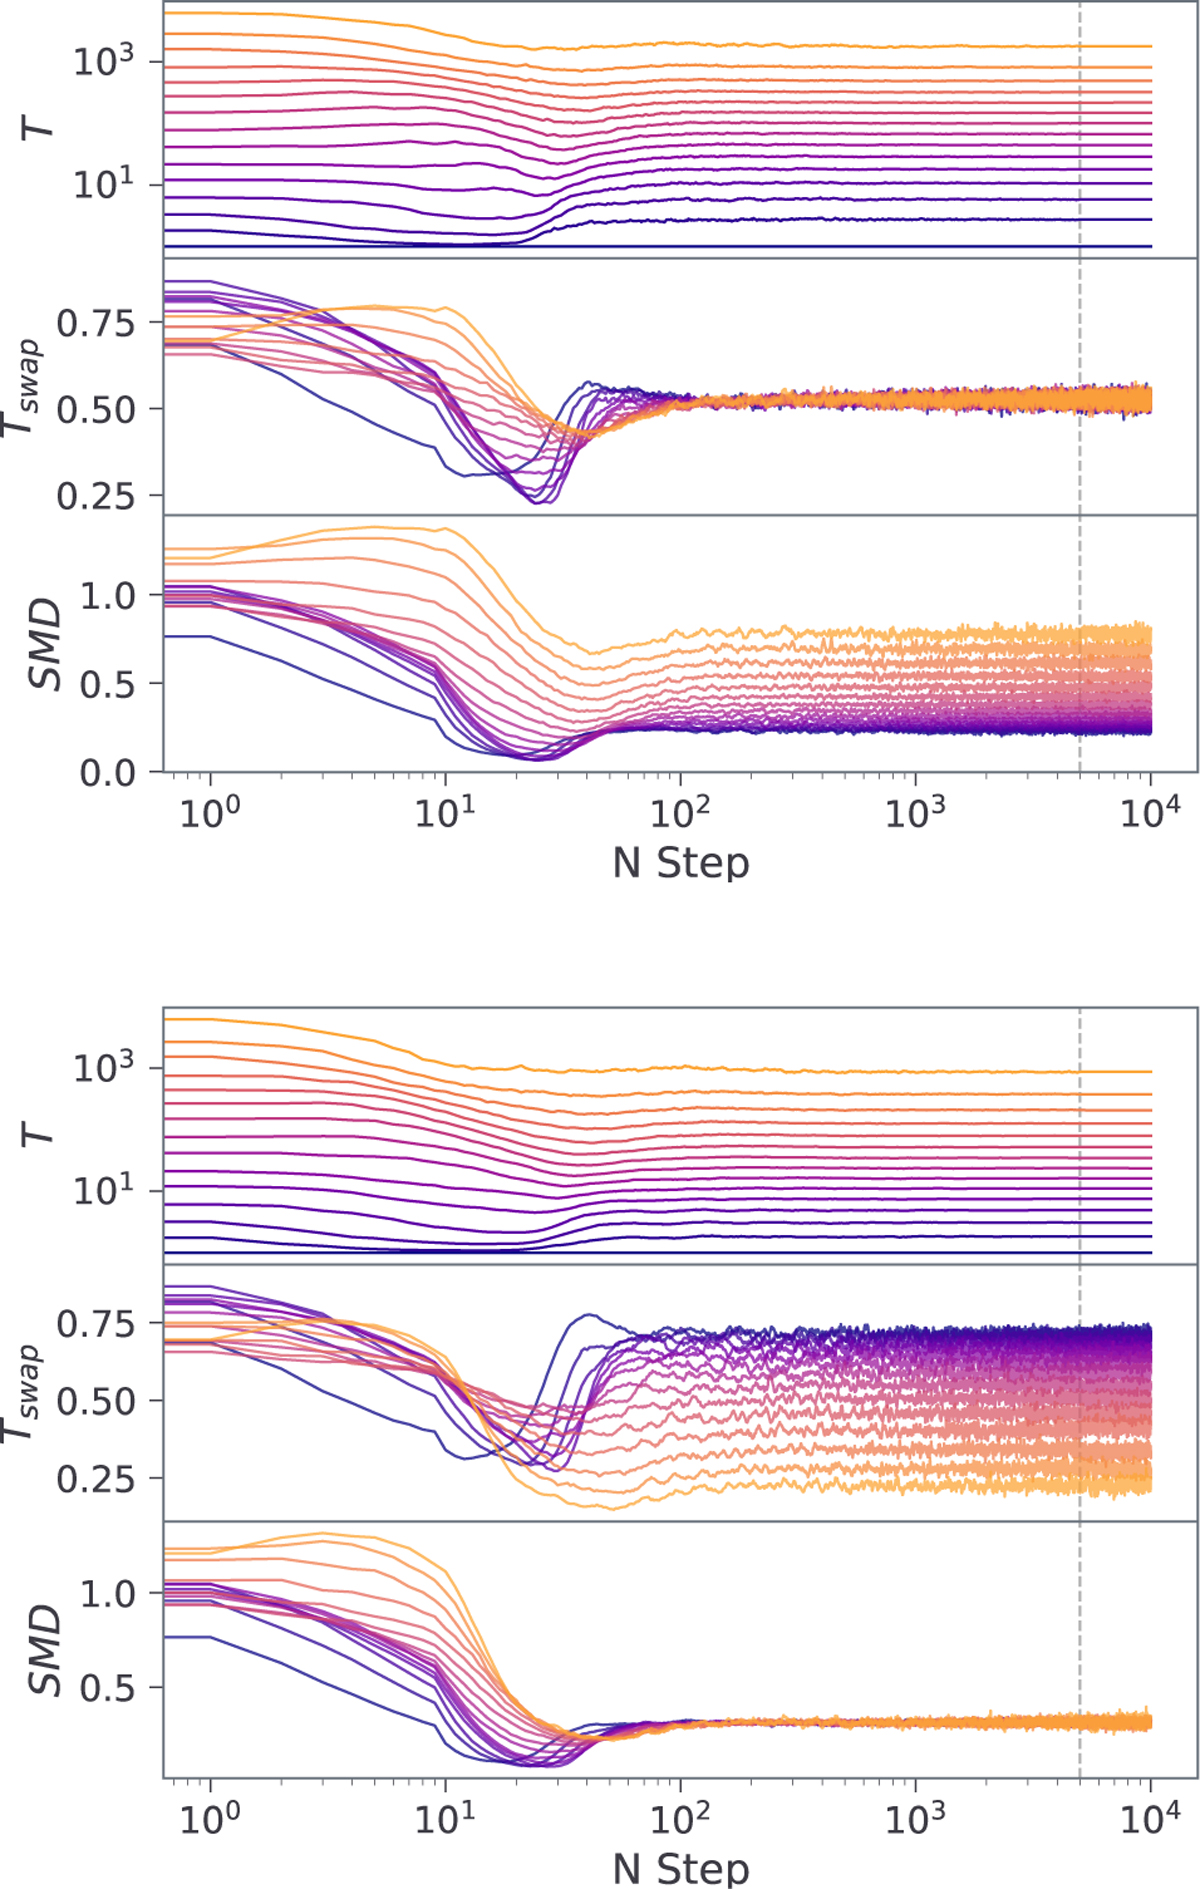
Temperature ladder evolution for the 15D Gaussian shells in the SAR regime (top) and SMD regime (bottom). In the x-axis is the current iteration. From top to bottom are the temperature ladder evolution, T, the swap acceptance ratio, Tswap, and the SMD. Colours represent each chain, where blue is the coldest (β=1), with temperature increasing towards the red, where the hottest chain is omitted. The vertical dashed black line indicates where the adaptation stops.
Current usage metrics show cumulative count of Article Views (full-text article views including HTML views, PDF and ePub downloads, according to the available data) and Abstracts Views on Vision4Press platform.
Data correspond to usage on the plateform after 2015. The current usage metrics is available 48-96 hours after online publication and is updated daily on week days.
Initial download of the metrics may take a while.