Open Access
Fig. 5
Download original image
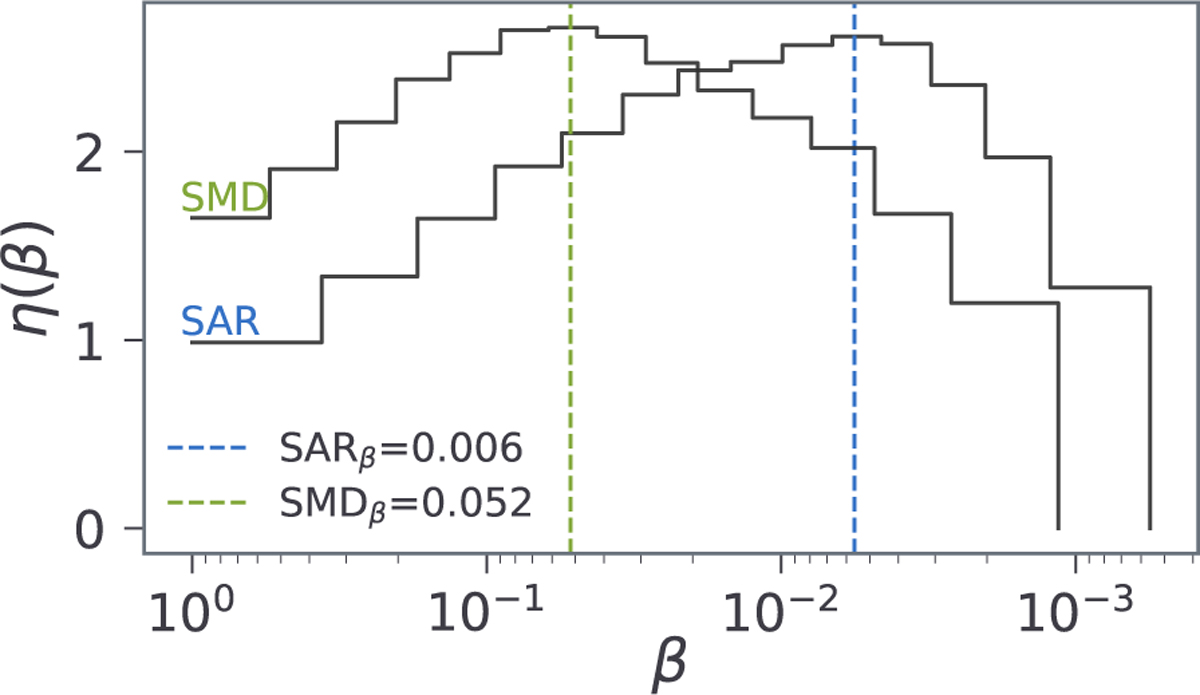
Chain density per temperature range for the SAR and SMD methods in the 15D Gaussian shells. The dashed blue line denotes the maximum of the SAR, with the green one representing the maximum of the SMD. Both lines also denote the regions where the TI or SS algorithms are applied in the hybrid method.
Current usage metrics show cumulative count of Article Views (full-text article views including HTML views, PDF and ePub downloads, according to the available data) and Abstracts Views on Vision4Press platform.
Data correspond to usage on the plateform after 2015. The current usage metrics is available 48-96 hours after online publication and is updated daily on week days.
Initial download of the metrics may take a while.