| Issue |
A&A
Volume 706, February 2026
|
|
|---|---|---|
| Article Number | A9 | |
| Number of page(s) | 17 | |
| Section | Extragalactic astronomy | |
| DOI | https://doi.org/10.1051/0004-6361/202556611 | |
| Published online | 27 January 2026 | |
JWST reveals extended stellar disks for ALMA-bright dusty star-forming galaxies in the Spiderweb protocluster
1
Purple Mountain Observatory, Chinese Academy of Sciences 10 Yuanhua Road Nanjing 210023, China
2
School of Astronomy and Space Science, University of Science and Technology of China Hefei Anhui 230026, China
3
Instituto de Astrofísica de Canarias (IAC) E-38205 La Laguna Tenerife, Spain
4
Universidad de La Laguna, Dpto. Astrofísica E-38206 La Laguna Tenerife, Spain
5
National Astronomical Observatory of Japan 2-21-1 Osawa Mitaka Tokyo 181-8588, Japan
6
Graduate University for Advanced Studies (SOKENDAI) 2-21-1 Osawa Mitaka Tokyo 181-8588, Japan
7
Tsung-Dao Lee Institute and State Key Laboratory of Dark Matter Physics, Shanghai Jiao Tong University Shanghai 201210, China
8
INAF–Osservatorio Astronomico di Capodimonte Salita Moiariello 16 80131 Napoli, Italy
9
Institute of Space and Astronautical Science, Japan Aerospace Exploration Agency, 3-1-1, Yoshinodai Chuou-ku Sagamihara Kanagawa 252-5210, Japan
10
European Southern Observatory Karl–Schwarzschild–Straße 2 D-85748 Garching bei München, Germany
11
Institute de Physique du Globe de Paris, 5 Rue Jussieu Paris, France
12
CEA-Saclay, IRFU, DAp, AIM 91191 Gif-sur-Yvette, France
13
National Radio Astronomy Observatory 520 Edgemont Road Charlottesville VA 22903, USA
14
Cosmic Dawn Center (DAWN), Denmark
15
DTU Space, Technical University of Denmark Elektrovej 327 DK-2800 Kgs. Lyngby, Denmark
16
Astronomical Institute, Tohoku University, 6-3 Aramaki Aoba-ku Sendai 980-8578, Japan
17
Université Lyon 1, ENS de Lyon, CNRS UMR5574, Centre de Recherche Astrophysique de Lyon F-69230 Saint-Genis-Laval, France
18
Astronomical Observatory Institute, Faculty of Physics and Astronomy, Adam Mickiewicz University ul. Słoneczna 36 60-286 Poznań, Poland
19
Centro de Astrobiología (CAB), CSIC-INTA Ctra. de Ajalvir km 4 Torrejón de Ardoz E-28850 Madrid, Spain
★ Corresponding author: This email address is being protected from spambots. You need JavaScript enabled to view it.
Received:
26
July
2025
Accepted:
4
December
2025
Abstract
We present JWST/NIRCam imaging of dusty star-forming galaxies (DSFGs) detected by the Atacama Large Millimetre/submillimetre Array (ALMA) in the Spiderweb protocluster at z = 2.16. We identified 22 DSFGs detected by both ALMA and JWST, ten of which are spectroscopically confirmed as protocluster members. This is the first systematic analysis of a statistical DSFG sample in z ∼ 2 protocluster environments using JWST/NIRCam data. Most of the DSFG members exhibit red colours and reside in the dusty star-forming region of the rest-frame UVJ diagram, indicating strong dust obscuration. The Gini-M20 diagram suggests that most DSFGs in this protocluster are late-type disks, with a significant fraction displaying clumpy and disturbed rest-frame UV/optical morphologies, but few showing clear merger signatures. The DSFG members exhibit relatively large stellar disks and effective radii with a median stellar mass of log(M/M⊙) = 10.8 ± 0.3, placing them above coeval field DSFGs and typical protocluster galaxies in the size–mass relation at both rest-frame optical and near-infrared wavelengths. These sizes are comparable to those of more evolved field DSFGs at z ∼ 1 − 2, indicating accelerated structural growth in dense environments. Moreover, these DSFG members show a decreasing trend in stellar size from shorter to longer wavelengths, with a moderately steep slope comparable to coeval field DSFGs. These results may support an inside-out growth scenario for protocluster evolution, in which massive galaxies near the centre are more evolved and more strongly affected by active galactic nucleus feedback and environmental effects, for example, ram-pressure stripping. We propose that the cold gas accretion at the protocluster outskirts drives intense star formation and stellar disk growth in ALMA-detected DSFGs, which are expected to evolve into massive elliptical galaxies at later stages.
Key words: galaxies: evolution / galaxies: formation / galaxies: high-redshift / galaxies: clusters: individual: Spiderweb / galaxies: starburst / submillimeter: galaxies
© The Authors 2026
 Open Access article, published by EDP Sciences, under the terms of the Creative Commons Attribution License (https://creativecommons.org/licenses/by/4.0), which permits unrestricted use, distribution, and reproduction in any medium, provided the original work is properly cited.
This article is published in open access under the Subscribe to Open model. This email address is being protected from spambots. You need JavaScript enabled to view it. to support open access publication.
1. Introduction
More than half of the cosmic star formation rate (SFR) has been heavily obscured by dust since z ∼ 4. This obscured fraction increases to approximately 80% (Bouwens et al. 2020; Dudzevičiūtė et al. 2020; Zavala et al. 2021) at the peak epoch of cosmic star formation (Madau & Dickinson 2014) and active galactic nucleus (AGN) activity (Hopkins & Beacom 2006; Zheng et al. 2009), commonly known as ‘cosmic noon’. Dusty star-forming galaxies (DSFGs) are a key population contributing to the majority of cosmic SFR density during cosmic noon (Casey et al. 2014; Hodge & da Cunha 2020), which is expected to evolve into massive elliptical galaxies in the local Universe (Lutz et al. 2001; Smail et al. 2002; Swinbank et al. 2006; Toft et al. 2014; Gullberg et al. 2019). DSFGs preferentially reside in the most massive dark matter halos (Blain et al. 2004; Hickox et al. 2012; Wilkinson et al. 2017), making them an ideal tracer of protoclusters–the largest large-scale structures at high redshift and progenitors of local mature galaxy clusters (Overzier 2016). This association is further confirmed by observations of DSFG overdensities within protoclusters across various redshifts (Greve et al. 2007; Tamura et al. 2009; Dannerbauer et al. 2014; Casey 2016; Arrigoni Battaia et al. 2018; Wang et al. 2021; Zhang et al. 2022; Calvi et al. 2023; Zhou et al. 2024a; Zhang et al. 2024; Zhou et al. 2024b). Therefore, investigating DSFGs within protocluster environments is essential for understanding the formation and evolution of massive galaxies and their connections to large-scale structures.
Over the past decades, DSFGs have been extensively studied and are characterized by high stellar masses (Wardlow et al. 2011; Simpson et al. 2014), intense SFRs (Blain et al. 2002; Chapman et al. 2005; Swinbank et al. 2014), and elevated AGN activity (Chapman et al. 2005; Wang et al. 2013). High-resolution observations with the Atacama Large Millimetre/submillimetre Array (ALMA; Wootten & Thompson 2009) at sub-arcsecond scales have revealed that some DSFGs exhibit disk-like structures in their dust components (Hodge et al. 2016; Gullberg et al. 2019; Chen et al. 2020; Cochrane et al. 2021), with potential arm and bar features (Hodge et al. 2019). The discovery of rotating disks confirmed by kinematic analyses further supports the presence of these structures in a substantial portion of the DSFG population (Hodge et al. 2012; Chen et al. 2017; Lelli et al. 2021; Rizzo et al. 2021; Birkin et al. 2024; Venkateshwaran et al. 2024; Amvrosiadis et al. 2025). Previous studies have shown that the stellar components of most DSFGs exhibit disturbed morphologies with clumpy features (Swinbank et al. 2010; Chen et al. 2015; Gómez-Guijarro et al. 2018; Cowie et al. 2018; Zavala et al. 2018; Lang et al. 2019; Ling & Yan 2022) and have stellar size measurements larger than that of their dust components observed at far-infrared wavelengths (Hodge et al. 2016; Gullberg et al. 2019; Chen et al. 2022; Cochrane et al. 2021). Major mergers have been proposed as a main driver of the starburst activity in DSFGs (Chen et al. 2015; Cowie et al. 2018); however, this conclusion is primarily based on Hubble Space Telescope (HST) observations that probe the rest-frame UV and optical bands of these galaxies, which are heavily affected by dust extinction (Hainline et al. 2011; da Cunha et al. 2015; Simpson et al. 2017; Lang et al. 2019; Dudzevičiūtė et al. 2020; Popping et al. 2022). Some studies, however, suggest that mergers do not play a more important role in driving star formation in DSFGs compared to general galaxy populations (Swinbank et al. 2010; Targett et al. 2013; Ren et al. 2025), as indicated by cosmological hydrodynamical simulations (McAlpine et al. 2019).
Recently, the James Webb Space Telescope (JWST) has revealed disk-like stellar components with disturbed and clumpy structures in DSFGs at z ∼ 2 − 4 (Cheng et al. 2022, 2023; Gillman et al. 2023; Fujimoto et al. 2025; Wu et al. 2023; Rujopakarn et al. 2023; Boogaard et al. 2024; Le Bail et al. 2024; Liu et al. 2024), along with a notable prevalence of bar and bulge features (Chen et al. 2022; Smail et al. 2023; Gillman et al. 2024; McKinney et al. 2025; Espejo Salcedo et al. 2025; Hodge et al. 2025) which are invisible in previous HST observations. The broad wavelength coverage (1 − 5 μm) of JWST has further confirmed a decreasing trend in stellar sizes from shorter to longer wavelengths (Cheng et al. 2022; Gillman et al. 2023; Price et al. 2025; Boogaard et al. 2024), which are apparently larger than the compact dust structures (Chen et al. 2022; Tadaki et al. 2023; Hodge et al. 2025). The similar merger fraction of DSFGs compared to that of general field galaxies also suggests that major mergers do not play a primary role in triggering their intense star formation (Gillman et al. 2023; McKay et al. 2025; Ren et al. 2025). Moreover, larger stellar disks in individual galaxies have been reported in several protoclusters compared to coeval field galaxies (Colina et al. 2023; Crespo Gómez et al. 2024; Wang et al. 2025; Umehata et al. 2025a), suggesting accelerated size growth in overdense environments as seen in simulations (Esposito et al. 2025). However, due to the limited sample size, the origins of DSFGs with stellar disks and intense star formation, particularly in overdense environments, remain to be explored.
The Spiderweb protocluster is one of the most massive galaxy protoclusters at z ∼ 2 − 3 and has been extensively studied for over twenty years, following the initial discovery of its central radio galaxy (Roettgering et al. 1994; Pentericci et al. 1997; Miley et al. 2006) and surrounding overdense environments (Kurk et al. 2000; Pentericci et al. 2000). Several hundred hours of observations, spanning from X-ray to radio wavelengths, have spectroscopically confirmed over one hundred member galaxies and established the overdensity of various galaxy populations, including X-ray sources, Lyα emitters (LAEs), Hα emitters (HAEs), Paβ emitters, CO(1−0) emitters, submillimetre galaxies (SMGs), DSFGs, and quiescent galaxies, (Pentericci et al. 2000, 2002; Kurk et al. 2000, 2004a,b; Croft et al. 2005; Kuiper et al. 2011; Koyama et al. 2013; Tanaka et al. 2013; Rigby et al. 2014; Dannerbauer et al. 2014; Shimakawa et al. 2014, 2018, 2024a; Zeballos et al. 2018; Jin et al. 2021; Tozzi et al. 2022a,b; Daikuhara et al. 2024; Zhang et al. 2024; Naufal et al. 2024). Considerable efforts have been dedicated to examining the environmental effects of the surrounding overdensity on member galaxies from multiple perspectives, such as UV morphologies (Naufal et al. 2023), star formation and gas-phase metallicity (Pérez-Martínez et al. 2023), dust extinction (Pérez-Martínez et al. 2024), AGN activity (Tozzi et al. 2022a; Shimakawa et al. 2024b, 2025), and the cold molecular gas content (Dannerbauer et al. 2017; Emonts et al. 2016, 2018; Chen et al. 2024; Pérez-Martínez et al. 2025). The recent discovery of a nascent intracluster medium (ICM) (Di Mascolo et al. 2023) and a diffuse hot halo (Tozzi et al. 2022b; Lepore et al. 2024) confirms that the Spiderweb protocluster will ultimately evolve into a mature galaxy cluster in the local Universe, making this structure an ideal laboratory for investigating the nature of DSFG members and their relationship with the surrounding overdense environment.
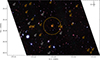 |
Fig. 1. JWST colour-composite (F410M/F182M/F115W for RGB) image of the Spiderweb protocluster. The 22 ALMA sources detected by JWST and the eight undetected ones are marked with orange and white squares, respectively, with their IDs labelled nearby. The Spiderweb galaxy is marked as a star, which represents the centre of the protocluster. The dashed circle shows the r500 = 229 kpc derived from the recently detected Sunyaev–Zeldovich signal (Di Mascolo et al. 2023). |
In this paper, we utilize newly acquired JWST data (Shimakawa et al. 2024a; Pérez-Martínez et al. 2024) to identify ALMA-detected DSFGs and construct the first statistical sample of DSFGs in z ∼ 2 protocluster environments. In Section 2, we describe the observations and results of counterpart identification of these DSFGs. Section 3 presents the results of both non-parametric and parametric morphological analyses of our DSFG sample, followed by a discussion of their origins and evolutionary trajectories in Section 4. We summarize our findings in Section 5. For simplicity, we refer all sources detected by submillimetre/millimetre facilities as DSFGs, including the traditional SMGs detected by single-dish telescopes. Throughout this paper, we assume a flat ΛCDM cosmology with H0 = 71 km s −1 Mpc−1, ΩΛ = 0.7 (Spergel et al. 2003, 2007), which corresponds to a scale of 0.490 physical Mpc (pMpc) or 1.549 comoving Mpc (cMpc) per arcmin at z = 2.16.
2. Datasets
2.1. ALMA observations
The ASW2DF is a 1.2 mm ALMA survey covering ∼20 arcmin2 across six contiguous fields centred on the Spiderweb galaxy. The observations were conducted between December 2021 and April 2022 in Cycle 8 (Project ID: 2021.1.00435.S; PI: Y. Koyama), with a total on-source time of 12.84 h. After the data reduction with Common Astronomy Software Applications (CASA version 6.2.1.7; CASA Team 2022), the final images reach a sensitivity range of 40.3 − 57.1 μJy at a spatial resolution of  . Source catalogues were constructed using three independent tools to ensure detection robustness, identifying 47 reliable ALMA sources (> 4σ) with an estimated 90% purity in the main catalogue. We refer the reader to Zhang et al. (2024) for more details about the observations and source extractions.
Physical properties of the ten DSFG members in the Spiderweb protocluster.
2.2. JWST/NIRCam imaging
The JWST/NIRCam (Rieke et al. 2005) observations of the Spiderweb protocluster covered an area of 3 × 6 arcmin2 using four filters to trace rest-frame U, V, J band continuum (F115W, F182M, F410M), and Paβ emission (F405N) at z = 2.16 (ID: 1572, Dannerbauer et al. 2021). With integration times ranging from 21 to 63 minutes, the reduced images achieve median 5σ depths of 25.4, 24.3, 23.3 and 24.6 mag in a  diameter aperture for the F115W, F182M, F405N and F410M filters, respectively (Pérez-Martínez et al. 2024). Sources were extracted using SEXTRACTOR in dual-image mode, with a median-stacked detection image. We refer the reader to Shimakawa et al. (2024a) and Pérez-Martínez et al. (2024) for more details about the data and source selection. Astrometric calibration using 18 Gaia EDR3 stars resulted in an alignment within
  of HST/ACS images.
3. Results
3.1. JWST+ALMA counterparts
The overlapping region between the ALMA and JWST footprints encompasses 3.9 × 3.3 arcmin2, covering approximately 60% of the JWST/NIRCam field of view (Shimakawa et al. 2024a). By cross-matching the ALMA and JWST/NIRCam catalogues with a  radius, we identified 30 ALMA sources located within the JWST coverage. Among these, 22 are detected in more than one NIRCam filters, corresponding to a detection rate of 73%. All of the 30 ALMA sources are overlaid on the composite colour image in Figure 1.
Figure 2 shows the signal-to-noise ratio (S/N) distribution of all 30 ALMA sources. Notably, all sources with S/N > 5 are detected by JWST, supporting the reliability of our ALMA source extraction. We note that eight ALMA sources are not detected by JWST in any of the F115W, F182M, F405N, or F410M filters above 1.5σ at the limiting magnitudes of 23.3 − 25.4, and their cutouts are presented in Appendix A. Most of the JWST–undetected sources are located on the eastern side of the ALMA field (Figure 1), where the imaging has higher angular resolution and therefore a larger number of synthesized beams (Zhang et al. 2024), increasing the likelihood of spurious detections. Based on the estimated image purity (Zhang et al. 2024), approximately five of the 30 ALMA sources within the JWST coverage are expected to be spurious, which is somewhat fewer than the eight JWST–undetected sources identified above. The nature of these additional JWST–undetected sources remains uncertain. One plausible explanation is that they represent extremely dust–obscured systems, such as NIRCam–dark galaxies (Pérez-González et al. 2024; Sun et al. 2025).
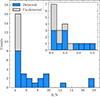 |
Fig. 2. Signal-to-noise ratio distribution of the 30 ALMA sources within the JWST/NIRCam footprint. The 22 sources detected by JWST are indicated in blue, while the eight undetected sources are shown in grey. |
We cross-match the 22 JWST-detected ALMA sources with known protocluster members to assess their membership status. Six sources (ASW2DF.05, 12, 17, 20, 23, and 28) are confirmed as Hα emitters (HAEs) (Shimakawa et al. 2014; Dannerbauer et al. 2017; Pérez-Martínez et al. 2023; Shimakawa et al. 2024b), while eight (ASW2DF.05, 12, 14, 17, 20, 23, 29, and 47) have been identified as CO emitters (Jin et al. 2021), five of which host extended molecular gas reservoirs (Dannerbauer et al. 2017; Chen et al. 2024).
Additional redshift constraints are obtained from our HST/WFC3 G141 grism observations (ID: 17117; Koyama et al. 2022), which confirm ASW2DF.04 as a protocluster member (Naufal et al. 2024). In summary, ten of the 22 ALMA sources detected by JWST are confirmed members of the Spiderweb protocluster, while the remaining sources lack spectroscopic redshift information are presented in Appendix B. Table 1 summarizes the positions, redshifts, stellar masses, ALMA-derived SFRs, and associations with various galaxy populations of the ten confirmed DSFG members. We emphasize that this represents the first systematic study of a statistical DSFG sample in z ∼ 2 protocluster environments using JWST/NIRCam data.
3.2. Colours
Figure 3 shows cutout images of the ten DSFG members in four JWST/NIRCam filters and corresponding colour composites. Most sources are faint in the short-wavelength (SW) filters (F115W and F182M) but appear significantly brighter in the long-wavelength (LW) filters (F405N and F410M). The colour composites further reveal that the majority of sources are distinctly red, indicative of strong dust obscuration.
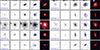 |
Fig. 3. Gallery of ten protocluster members detected by both ALMA and JWST/NIRCam, with a cutout size of 4 × 4 arcsec. The names of the four filters are shown in the first row. The ALMA 1.2 mm contours at [2σ, 3σ, 4σ] are overlaid on the F405N image in the fourth column for each source, with a blue bar showing a physical distance of 5 kpc. The RGB-composite (F410M/F182M/F115W) colour images are shown in the fifth column. The source IDs are positioned in the lower-left corner of each group of panels, consistent with the numbering in Fig. 1. |
Moreover, the galaxy morphologies vary significantly across different filters. Given the redshift of the Spiderweb protocluster (z = 2.16), the F410M filter probes the rest-frame near-infrared (NIR) and effectively traces the stellar components of the associated DSFGs. In F410M, most sources display smooth disk morphologies, with several exhibiting clear spiral features, suggesting that mergers have not recently disturbed their stellar morphology. In contrast, in the bluer filters, which trace ongoing star formation and younger stellar populations, many galaxies show irregular shapes and clumpy structures within their disks; a few even exhibit multiple components, indicative of clumpy star formation, inhomogenous dust distribution, or potential merger activity. In such cases, the ALMA-detected dust emission might be spatially offset from the stellar continuum traced by JWST (e.g. a 0.5″ offset for ASW2DF.29). Overall, the sample reveals a population of very red, disk-like galaxies undergoing intense, dust-obscured star formation, consistent with recent findings that DSFGs are predominantly disk galaxies hosting vigorous star formation (Cheng et al. 2023; Liu et al. 2023; Magnelli et al. 2023; Wu et al. 2023; Rujopakarn et al. 2023; Gillman et al. 2024; Fujimoto et al. 2025). As shown in Figure 3, the central Spiderweb galaxy (ASW2DF.17) is significantly affected by PSF contamination across all JWST/NIRCam filters, prominently due to its intense AGN activity. Therefore, we exclude it from the subsequent morphological analysis.
The UVJ diagram (Williams et al. 2009; Brammer et al. 2011; Whitaker et al. 2011) has been widely used to classify high-redshift galaxies into star-forming and quiescent populations in the JWST era (Ren et al. 2024; Ji et al. 2024; Ito et al. 2024; Martorano et al. 2024; Polletta et al. 2024). We use the total magnitudes measured in F115W, F182M, and F410M filters to trace the rest-frame U, V, and J colours of the nine DSFG members. The resulting rest-frame UVJ diagram is shown in Fig. 4, with the criteria to separate star-forming and quiescent galaxies according to Whitaker et al. (2011). We also present the normal star-forming galaxies and quiescent galaxies at z ∼ 2 − 3 from JWST/CEERS and JADES surveys in Fig. 4 for a comparison (Ren et al. 2024). It is evident that all ALMA sources are located in the star-forming region of the UVJ diagram. Most are concentrated in the upper-right region, clearly offset from the bulk of normal star-forming galaxies in the field, highlighting their dusty star-forming nature.
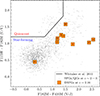 |
Fig. 4. Rest-frame UVJ (F410M, F182M, and F115W) diagram of the nine JWST-detected DSFG members, marked with their IDs. The criteria to separate the quiescent and star-forming regions are adopted from Whitaker et al. (2011). The normal star-forming galaxies and quiescent galaxies at z ∼ 2 − 3 from JWST/CEERS and JADES surveys are shown with grey dots (Ren et al. 2024). |
3.3. Non-parametric morphologies
Thanks to the high spatial resolution and the broad wavelength coverage up to 4 μm provided by JWST/NIRCam, we are able to study the morphologies of the stellar components (traced by rest-frame NIR) in our DSFG sample for the first time. Significant efforts have already been made on structural studies of ALMA-selected DSFGs with newly acquired JWST data (Boogaard et al. 2024; Chen et al. 2022; Cheng et al. 2022, 2023; Colina et al. 2023; Crespo Gómez et al. 2024; Fujimoto et al. 2025; Gillman et al. 2023, 2024; Hodge et al. 2025; Kamieneski et al. 2023; Le Bail et al. 2024; Liu et al. 2024; Price et al. 2025; Polletta et al. 2024; Rujopakarn et al. 2023; Smail et al. 2023; Tadaki et al. 2023; Wu et al. 2023; Umehata et al. 2025a,b), which could be utilized in this paper to compare DSFGs in field and protocluster environments.
Two approaches are commonly used to measure the morphological properties of galaxies: non-parametric and parametric ways. In this subsection we primarily focus on the non-parametric analysis, which is advantageous for capturing the diverse and complex shapes of galaxies without assuming a specific parametric form for the galaxy profiles.
We performed the non-parametric morphological analysis using the code statmorph (Rodriguez-Gomez et al. 2019), which could return various quantitative parameters including Gini (G) and M20 coefficients (Abraham et al. 2003; Lotz et al. 2004), and the concentration (C), asymmetry (A), and smoothness/clumpiness (S) indicators (CAS; Bershady et al. 2000; Conselice 2003; Lotz et al. 2004). We use the background-subtracted images to make a cutout in a size of 201 × 201 pixels (6″ × 6″) for each source. The PYTHON package Photutils is employed to create a segmentation of each target based on the F410M image, with a detection threshold of 1.5σ. Subsequently, we run statmorph in all three images (F115W, F182M, and F410M), assessing the results with a flag and S/N per pixel for each source in each filter. The flag indicates the quality of the basic morphological measurements, which can be zero to five from good to catastrophic. We only retain robust results with a flag equal zero (Rodriguez-Gomez et al. 2019), or an S/N per pixel greater than two (Lotz et al. 2004). Finally, we obtain robust non-parametric morphological measurements for all nine DSFG members in the F410M image, and for three and two members in the F182M and F115W images, respectively. Among them, two sources (ASW2DF.05 and ASW2DF.23) yield reliable measurements across all three filters.
We mainly employ the Gini (G) and M20 coefficients to classify our DSFGs in this work. The Gini coefficient assesses the distribution of light across the pixels within a galaxy. A value of one indicates that all the flux is concentrated in a single pixel, while G = 0 means a perfectly uniform surface brightness. The M20 coefficient quantifies the second-order moment of the pixels contributing 20% of the total flux in a galaxy. A more negative M20 value suggests that the light is more centrally concentrated, and vice versa. Specifically, we adopt the ‘bulge statistic’ and ‘merger statistic’ (Lotz et al. 2008; Snyder et al. 2015a,b) criteria, in which the former distinguishes early-type (E/S0/Sa) and late-type (Sb/Sc/Irr) galaxies, while the latter separates the mergers and non-mergers in the Gini-M20 plane.
Fig. 5 shows the Gini-M20 diagram of our DSFG members. Sources with reliable measurements in any of the three filters are shown in squares, colour coded by the filters (RGB for F410M/F182M/F115W). The same measurements for a sample of DSFGs in the CEERS field (Gillman et al. 2023), and three massive dusty starbursts which is possibly related to a proto-structure at cosmic noon (Polletta et al. 2024) are also shown in Fig. 5 for a comparison.
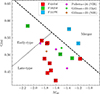 |
Fig. 5. Gini-M20 diagram of nine DSFG members across the following three filters: F410M (red), F182M (green), and F115W (blue). The medians of the field DSFG sample are depicted as orange and lime diamonds in the rest-frame optical and NIR bands (Gillman et al. 2024). Three extremely dusty starburst at cosmic noon are also shown as magenta circles for a comparison (Polletta et al. 2024). |
The majority of our sample lies in the late-type galaxy region, exhibiting a broad range of Gini and M20 values, consistent with our visual classifications and previous studies of field DSFGs (Ling & Yan 2022; Gillman et al. 2023). Specifically, eight out of nine DSFG members are classified as late-type galaxies in the F410M filter. The exception, ASW2DF.12, is categorized as early-type in both F410M and F182 filters. This is due to the presence of a strong central AGN as previously confirmed (Tozzi et al. 2022a; Shimakawa et al. 2024b). Two members are classified as mergers in the F115W filter. ASW2DF.23 is likely a minor merger system, consisting of a northern main component and a southern blue companion. In contrast, ASW2DF.05 exhibits a clear disk morphology in the other two filters, suggesting that its merger classification in F115W is likely due to strong dust attenuation affecting its rest-frame UV emission. These results suggest that, while localized starburst activity is common in these ALMA-selected DSFGs, their overall star formation is more likely driven by secular processes rather than major mergers. (Huang et al. 2025).
Among the sources (ASW2DF.05 and 23) with robust morphological measurements across all three filters, we observe a clear trend in their measured values, shifting from the late-type region towards the merger region at shorter wavelengths. A similar trend has been found for field DSFGs based on median measurements in the rest-frame optical and NIR bands (Gillman et al. 2023). This wavelength-dependent shift reflects the underlying stellar populations: rest-frame NIR emission, tracing older and redder stars, reveals a more stable and centrally concentrated morphology, while rest-frame UV emission, tracing recent star formation, appears significantly more clumpy and disturbed. This is further supported by the smoothness ratios in our sample, with median values of SU/SV = 2.8 and SU/SJ = 2.4, indicating that ongoing star formation is substantially more clumpy than the stellar distribution. These results are consistent with the inside-out galaxy evolution scenario, in agreement with previous studies on field DSFGs (Chen et al. 2022; Gillman et al. 2023; Kamieneski et al. 2023). However, we note that the boundaries in the Gini–M20 diagram were originally defined at rest-frame 0.65 μm and are therefore strictly applicable to the F182M filter. As a result, the apparent trend towards the merger region at shorter wavelengths may be subtle, since classifications could differ in the F115W and F410M filters, and the sample sizes in the F115W and F182M filters are limited.
3.4. Parametric morphologies
In addition to the non-parametric morphological analysis described above, we obtain parametric measurements of the DSFG members using Galight (Ding et al. 2020, 2021), which has been widely adopted on JWST data (Yang et al. 2022; Ding et al. 2022, 2023; Williams et al. 2023; Liu et al. 2024; Zhuang & Shen 2024; Casey et al. 2024) and demonstrated to be robust (Kawinwanichakij et al. 2021; Yang et al. 2021; Casey et al. 2024) compared to the commonly used GALFIT (Peng et al. 2002). We employ Galight to select several unsaturated point sources in each of the three filters and generate an empirical PSF through a median stacking approach. We note that the Full Width Half Maximum (FWHM) of our PSFs are overall larger than the theoretical PSF generated by WebbPSF (Perrin et al. 2012, 2014), while comparable with the empirical PSFs extracted from archival JWST/NIRCam data (Finkelstein et al. 2023) within 5% uncertainty, confirming the robustness of our PSF extraction.
Similarly, we create a background-subtracted cutout for each source in each filter, sized at 201 × 201 pixels (6 × 6 arcsec). The detection thresholds are adjusted adaptively to ensure that the segmentation encompasses the entire galaxy, particularly in bluer filters (e.g. F115W), where the galaxy may exhibit multiple clumps. We individually verify the segmentation for each sources to maintain consistency across all three filters and alignment with the segmentation previously generated using statmorph. We fit the target galaxy along with any possible nearby companions with single Sérsic model, and mask out other sources within each cutout. We determine the uncertainty for each parameter by deriving the 1σ interval of the posterior distribution. Finally, we obtain robust size measurements for all the nine DSFG members across F115W, F182M and F410M filters. Interestingly, Galight provides a function that compiles all data for each source and feeds it into statmorph to obtain non-parametric morphological measurements. We confirm the reliability of our results by validating the consistency of statmorph outputs across both approaches.
3.4.1. Effective radii
We convert the effective radii of the nine DSFG members into physical scales using their respective redshifts. In Fig. 6 we present the effective radii as a function of Sérsic indices of these protocluster members derived from the F410M image, which traces the stellar components at rest-frame NIR wavelength. For comparison, we compile the size measurements at rest-frame near-infrared wavelengths for field DSFGs from the literature (Cheng et al. 2022, 2023; Boogaard et al. 2024; Price et al. 2025; Ren et al. 2025), and divide them into two redshift bins: 27 sources at z ∼ 1 − 1.5 and 55 sources at z ∼ 2 − 2.5. These two groups are shown as magenta and green circles in Fig. 6, respectively. For each bin, the median values and their median absolute deviations are indicated by larger markers of the same colour, along with corresponding error bars. We note that the effective radii of field DSFGs at higher redshift are systematically smaller than those at lower redshift, as observed in several JWST studies (Gillman et al. 2023; Ren et al. 2025).
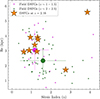 |
Fig. 6. Rest-frame near-infrared effective radii, measured from the F410M filter, are plotted against Sérsic indices for the nine DSFG members in the Spiderweb protocluster. For comparison, 27 (55) field DSFGs at z ∼ 1 − 1.5 (z ∼ 2 − 2.5) from the literature (Cheng et al. 2022, 2023; Boogaard et al. 2024; Price et al. 2025; Ren et al. 2025) are shown as violet and pink circles, respectively. The median values for each redshift bin, along with their median absolute deviations, are indicated by larger markers of the same colour with corresponding error bars. |
It is clearly seen that our DSFG sample exhibits systematically larger effective radii relative to field DSFGs at similar redshifts. Two outliers, ASW2DF.12 and ASW2DF.29, deviate from this overall trend. The size measurement of ASW2DF.12 is likely affected by an X-ray AGN at its centre (Tozzi et al. 2022a; Shimakawa et al. 2024b), while ASW2DF.29 shows an irregular morphology characterized by a bright core, small blue clumps, and a clear spatial offset between the dust (traced by ALMA) and stellar components–indicative of strong asymmetry and heavy dust obscuration. These features suggest ASW2DF.29 is likely a recent merger hosting partially obscured starbursts and a nascent AGN. Despite these two exceptions, the sample as a whole remains significantly larger than coeval field DSFGs.
Moreover, the effective radii and Sérsic indices of our DSFG sample closely match those of field DSFGs at z ∼ 1 − 1.5, as shown in Fig. 6. We attribute this size similarity to accelerated evolution driven by the gas-rich and overdense environment of the protocluster. This environment promotes the growth of more extended star-forming regions and larger stellar disks, causing our DSFG members to exhibit sizes comparable to field DSFGs approximately 2 Gyr later. However, given the limited sample size and focus on a single protocluster, larger samples across multiple protoclusters are needed to confirm this scenario.
3.4.2. Size-mass relation
The conclusions above are based on a comparison of overall sizes between DSFGs in the Spiderweb protocluster and coeval field DSFGs, without accounting for stellar mass. Out of our ten spectroscopically confirmed ALMA-detected sources, we exclude the Spiderweb galaxy (ASW2DF.17) from our analysis given its singular nature. We obtain stellar masses for five of the nine remaining ALMA-detected sources (ASW2DF.05, 12, 20, 23, 28) from Pérez-Martínez et al. (2023), where they were identified as HAEs (see Table 1). Their stellar masses are based on up to ten-band SED modelling using a Chabrier (2003) initial mass function (IMF) and covering rest-frame UV to NIR wavelengths (B band to Spitzer/IRAC 3.6 and 4.5 μm in the observed frame), a range that captures the bulk of the stellar emission and yields estimates with typical uncertainties of ≲0.2 dex (see Pérez-Martínez et al. 2023 for more details). The remaining four sources (ASW2DF.04, 14, 29, 47) were not included in that study, and thus no SED-based stellar masses are available. Visual inspection of the multiband imaging confirms that these galaxies are either undetected or fall below the 5σ depth in many ground-based bands, leaving SED fitting significantly unconstrained. However, the JWST observations are deeper than the pre-existing datasets, and all four sources are securely detected in the relevant NIRCam bands, enabling us to apply alternative methods. We therefore estimate their stellar masses using their F115W–F182M colours and F410M-based NIR luminosities, adopting the mass-to-light ratio prescriptions from Bell et al. (2003) and correcting for a Chabrier (2003) IMF. Similar model-based mass-to-light approaches, albeit with different prescriptions have also been successfully used in past works up to z ∼ 2 (e.g. Kriek et al. 2008; Koyama et al. 2013). We validate our approach by confirming that it reproduces, within reasonable uncertainties (0.17 dex standard deviation), the SED-derived stellar for our first five sources, thereby supporting its robustness for the rest of the sample (see Appendix D).
Figure 7 presents the rest-frame optical and NIR effective radii as a function of stellar mass of our DSFG members. For comparison, we include empirical size–mass relations derived from JWST data for star-forming galaxies and quiescent galaxies at z ∼ 2 − 3 (Ward et al. 2024; Ji et al. 2024; Martorano et al. 2024), as well as rest-frame optical sizes of z ∼ 2.2 HAEs in protocluster environments (Liu et al. 2023; Pérez-Martínez et al. 2023). Archival measurements of DSFGs at rest-frame NIR wavelengths from recent JWST studies are also shown (Cheng et al. 2022, 2023; Polletta et al. 2024; Price et al. 2025; Ren et al. 2025).
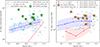 |
Fig. 7. Left: Rest-frame optical size-mass relation of the nine DSFG members in the Spiderweb protocluster, with effective radii measured using the F182M filter. For comparison, HAEs from the BOSS1244/1542 (Liu et al. 2023) and Spiderweb protoclusters (Pérez-Martínez et al. 2023), as well as field DSFGs at similar redshifts (Ren et al. 2025), are shown. The optical size-mass relations of field star-forming and quiescent galaxies at z ∼ 2.2 are also included (Ward et al. 2024; Ji et al. 2024). Right: Rest-frame NIR size-mass relation of the nine DSFG members, measured using the F410M filter. Archival DSFG samples from recent JWST studies are presented for comparison (Cheng et al. 2022, 2023; Polletta et al. 2024; Price et al. 2025; Ren et al. 2025), along with the NIR (1.5 μm) size-mass relations of star-forming and quiescent galaxies at z ∼ 2 − 2.5 (Martorano et al. 2024). |
As shown in Fig. 7, the nine DSFGs in the Spiderweb protocluster are systematically larger than coeval star-forming galaxies at fixed stellar mass, in both rest-frame optical and NIR wavelengths. These galaxies also represent the largest systems among the HAE populations in protocluster environments. It is worth noting that the effective radii of HAEs in BOSS protoclusters were measured using HST/F160W imaging, which corresponds to rest-frame 0.5 μm at z ∼ 2.2 (Liu et al. 2023). Also, the size measurements of HAEs in the Spiderweb protocluster were made in the Ks band, corresponding to rest-frame 0.7 μm at z ∼ 2.16 (Pérez-Martínez et al. 2023). These rest-frame wavelengths differ slightly from the rest-frame 0.57 μm traced by F182M for our DSFG members, which may introduce systematic uncertainties of up to ∼20 − 30% in the measured sizes, following the size–wavelength relation discussed in the next subsection.
Additionally, the F182M image is shallower than the F115W and F410M images, reducing its sensitivity to low surface brightness features and underestimating galaxy sizes compared to measurements in both bluer and redder bands (see Fig. 3). When focusing on the rest-frame NIR sizes derived from F410M, our DSFGs are not only larger than field star-forming galaxies at similar redshifts but also rank among the largest DSFGs with comparable stellar masses across both field and protocluster environments. While the archival JWST surveys used for comparison employed different filters and depths (e.g. Cheng et al. 2022, 2023; Polletta et al. 2024; Price et al. 2025; Ren et al. 2025), their samples–characterized by median redshifts of z ∼ 2 − 3 and rest-frame NIR measurements–remain well suited for a meaningful comparison with our DSFG sample. In summary, our sample exhibits larger sizes than both typical HAEs in protoclusters and field DSFGs at similar redshifts. Future JWST observations across multiple bands and environments will be essential to confirm and extend these findings.
3.4.3. Size-wavelength relation
We characterized the stellar morphologies and measured the dust component sizes in these DSFGs using ALMA 1.2 mm observations. The imfit function in CASA was used to model the sources with an elliptical Gaussian profile. Due to varying resolutions and depths across the six fields, some sources could not be deconvolved from the synthesized beam and remained unresolved, while a few failed the fitting process. Overall, six out of nine DSFG members had dusty component size measurements. The sizes were determined by the FWHM along the major and minor axes, and were circularized into effective radii using the following equation (Fujimoto et al. 2018):
 (1)
(1)
where re, maj is the radius along the major axis and q is the axis ratio, respectively.
We note that the sizes of the nine DSFG members were successfully measured across all three JWST/NIRCam filters, with four of them having additional size measurements of their dust components. In Fig. 8, we present the physical sizes of the stellar and dust components of our member DSFGs as a function of rest-frame UVJ bands and observed millimetre band. Their median values are shown in star symbols and linked together with black solid lines to demonstrate the size evolution across the four bands. Additionally, the size-wavelength relation of coeval DSFG samples is shown as different markers and colours for a comparison (Tadaki et al. 2023; Gillman et al. 2024; Price et al. 2025; Hodge et al. 2025; Ren et al. 2025). It is evident that all samples, whether in protocluster or field environments, follow a similar trend: galaxy sizes systematically decrease with increasing wavelength from rest-frame UV to NIR, and the stellar components are generally larger than the dust emission traced by ALMA (Tadaki et al. 2023; Gillman et al. 2024; Hodge et al. 2025). This result aligns with previous studies revealing that dust components are smaller than stellar components traced by rest-frame optical observations with HST (Calistro Rivera et al. 2018; Lang et al. 2019; Tadaki et al. 2020), but contrasts with recent findings from hydrodynamical simulations (Cochrane et al. 2019; Popping et al. 2022).
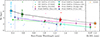 |
Fig. 8. Size-wavelength relation of the nine DSFG members in the Spiderweb protocluster. The individual measurements and median values are marked as circles and stars with different colours for corresponding wavelengths. Field DSFG samples at similar redshifts from recent JWST studies are shown with different markers and colours for a comparison (Tadaki et al. 2023; Gillman et al. 2024; Price et al. 2025; Hodge et al. 2025; Ren et al. 2025). The green point at rest-frame 0.4 μm represents the extrapolated result from the slope and the size at rest-frame 1 μm in Gillman et al. (2024). Solid lines indicate the decreasing slopes from rest-frame UV to NIR, while dashed lines connect the JWST and ALMA size measurements in each sample. |
Once again, our DSFG sample exhibits consistently larger size measurements across all observed bands compared to field DSFGs at similar redshifts. Specifically, the median effective radii of our DSFG sample at rest-frame UVJ and 380 μm are 5.8 ± 2.7 kpc, 5.1 ± 2.0 kpc, 3.2 ± 1.2 kpc and 2.2 ± 0.6 kpc, respectively. As the F182M filter corresponds to rest-frame 1.3 μm for our DSFG sample, archival measurements at the same wavelength yield sizes of 2.6 ± 0.2, 2.5 ± 0.1, and 1.8 ± 0.8 kpc for the DSFGs in Gillman et al. (2024), Ren et al. (2025), and Price et al. (2025), respectively, all smaller than the ∼3.2 kpc measured for DSFGs in the Spiderweb protocluster. Furthermore, we estimate the median stellar mass of our DSFG sample to be log(M/M⊙) = 10.8 ± 0.3, comparable to log(M/M⊙) = 11.2 ± 0.1 and log(M/M⊙) = 11.0 ± 0.3 in Gillman et al. (2024) and Ren et al. (2025) samples, but higher than the log(M/M⊙) = 10.3 ± 0.4 in Price et al. (2025) sample. These comparisons further indicate that our DSFG sample tends to have larger effective radii than their coeval field counterparts. The median stellar-to-dust size ratio for our protocluster members is 1.5 ± 0.7, consistent with the range of 1.6−2.7 reported for coeval field DSFGs (Tadaki et al. 2023; Gillman et al. 2024; Hodge et al. 2025). It is worth noting that previous studies measured dust sizes at 870 μm, while our measurements are based on 1.2 mm data, which may introduce systematic differences.
From rest-frame UV to NIR wavelengths, our DSFGs exhibit a pronounced decrease in size. The corresponding slope is comparable to that of field DSFGs, although field samples show considerable diversity in their measured slopes. For reference, Gillman et al. (2024) reported a size–wavelength slope of −0.60 ± 0.09 for DSFGs across similar wavelength ranges, which is steeper than the −0.15 ± 0.07 slope found for normal star-forming galaxies (see also Suess et al. 2022). Following the normalization procedure of Gillman et al. (2024), we obtain an even steeper slope of −1.20 ± 0.30 for our DSFG members. We speculate that two factors may contribute to this trend. First, the rest-frame UV sizes of our sources are likely inflated by centrally concentrated dust obscuration more strongly than in field DSFGs or normal star-forming galaxies. Second, the proximity of these DSFG members to large-scale filaments and extended gas reservoirs (Chen et al. 2024) may promote continuous gas accretion, fueling clumpy starbursts in their outskirts. Both effects could naturally lead to a steeper slope in the size–wavelength relation. For comparison, the slopes derived for the DSFG samples in Ren et al. (2025) and Price et al. (2025) are −0.94 ± 0.13 and −1.98 ± 0.52, respectively. The substantial differences among these values are likely driven by sample diversity–such as variations in sample size, stellar mass, and selection depth–and should therefore be interpreted with caution. Overall, samples with larger stellar masses tend to exhibit moderate slopes, as seen in our sample and in the literature (Gillman et al. 2024; Ren et al. 2025), whereas less massive DSFGs may show much steeper slopes (Price et al. 2025). A larger and more mass-complete sample will be essential for disentangling these factors and for quantifying the role of stellar mass in shaping the size–wavelength slope across different mass regimes.
3.5. Notes on individual member
This subsection presents individual descriptions of the nine DSFG members, detailing their counterpart identifications, morphologies, and any distinguishing structures. We summarize all morphological measurements of the nine DSFG members, as well as their brief descriptions in Table C.1. We note that the central Spiderweb galaxy (ASW2DF.17) is significantly affected by PSF contamination across all JWST/NIRCam filters, and thus excluded from the discussion on individual member.
3.5.1. ASW2DF.04
was not identified as an HAE or CO line emitter in previous studies (Shimakawa et al. 2018; Jin et al. 2021; Pérez-Martínez et al. 2023), but has recently been confirmed as a protocluster member based on HST observations (Naufal et al. 2024). It lies within the LABOCA beam of the single-dish source DKB02 (Dannerbauer et al. 2014), and is likely its dominant flux contributor. In JWST imaging, ASW2DF.04 shows a uniform disk morphology across all filters, although the F115W band reveals a slight central depression in brightness, suggestive of significant centrally concentrated dust attenuation. A small blue feature to the north-east may represent a low-redshift interloper.
3.5.2. ASW2DF.05
has been extensively studied as an HAE (Dannerbauer et al. 2017), and is the brightest CO emitter (Jin et al. 2021) with extended molecular gas reservoirs (Chen et al. 2024). It displays a prominent disk morphology with two grand-design spiral arms clearly visible in all JWST filters. From shorter to longer wavelengths, its central bulge becomes increasingly prominent, while the disk appears progressively smoother. Multiple star-forming clumps are evident in the F115W band, consistent with features previously identified in HST imaging (Dannerbauer et al. 2017).
3.5.3. ASW2DF.12
has been identified as an HAE, CO emitter, and X-ray source in previous studies (Jin et al. 2021; Tozzi et al. 2022a; Pérez-Martínez et al. 2023). Hosting a central AGN (Shimakawa et al. 2024b), it exhibits a compact and centrally concentrated morphology. Based on non-parametric morphological analysis, it is classified as an early-type galaxy, consistent with AGN-driven structural compaction. These features suggest it may represent a transitional phase in the quenching pathway of massive protocluster galaxies.
3.5.4. ASW2DF.14
is a confirmed CO emitter within the Spiderweb protocluster (Jin et al. 2021), and exhibits extended molecular gas reservoirs (Chen et al. 2024). It is barely visible in the F115W and F182M filters, but becomes clearly visible at longer wavelengths, where it resolves into two distinct components. This morphology strongly suggests that ASW2DF.14 is an ongoing merger.
3.5.5. ASW2DF.20
has been identified as both an HAE and a CO emitter (Jin et al. 2021; Pérez-Martínez et al. 2023). It shows a well-defined disk morphology across all JWST filters, with a compact central core. The diffuse, extended emission observed in the F115W band indicates the presence of widespread star-forming regions in the outer disk. A point-like blue component nearby is likely a foreground, low-redshift interloper.
3.5.6. ASW2DF.23
is a confirmed HAE and CO emitter (Jin et al. 2021; Pérez-Martínez et al. 2023). At shorter wavelengths, it appears fragmented into multiple clumps, while at longer wavelengths it presents a more coherent morphology consistent with a single galaxy. A small blue feature connected to the northern part of the main body suggests a possible minor merger.
3.5.7. ASW2DF.28
is identified as an HAE (Pérez-Martínez et al. 2023), and lies within the LABOCA beam of the single-dish source DKB15 (Dannerbauer et al. 2014). It is faint in the F115W and F182M filters, but displays a smooth, disk-like morphology at longer wavelengths.
3.5.8. ASW2DF.29
has the most complicated morphology in our sample. It has been identified as a CO emitter with extended molecular gas reservoirs (Jin et al. 2021; Chen et al. 2024). Across all JWST filters, it exhibits two distinct components to the north and south. The northern component features a bright central core, while the southern component aligns with the ALMA detection position. The presence of multiple components and irregular morphology strongly suggests that ASW2DF.29 is undergoing a merger.
3.5.9. ASW2DF.47
has been identified as a CO emitter (Jin et al. 2021). Similar to ASW2DF.14 and ASW2DF.28, it is barely detected in the F115W and F182M filters, but reveals a clear, smooth disk morphology at longer wavelengths.
Additionally, we measured the morphological properties of the remaining 12 ALMA sources lacking spectroscopic redshifts. These sources were visually inspected and are described individually below. ASW2DF.07, 10, 11, 15, 22, 24, and 26, 31 exhibit very red colours and generally smaller sizes compared to our DSFG sample, suggesting that they are high-redshift galaxies with significant dust obscuration. ASW2DF.19 is bright in all four filters, displaying a clear stellar disk and prominent starburst clumps, indicative of an ongoing starburst at a relatively lower redshift. Similarly, ASW2DF.35, 37, and 44 show extended stellar disks and strong emission across all four filters, resembling dusty star-forming galaxies at lower redshifts. A summary of the morphological measurements, along with brief notes on each source, is provided in Table C.2.
4. Discussion
4.1. The origin of extended stellar disks
In this section, we explore the star formation mode and the origin of extended stellar disks in the DSFG members. Stellar masses for the nine protocluster DSFGs are adopted from either the HAE catalogue by Pérez-Martínez et al. (2023) or derived from JWST observations, as described previously. We estimate SFRs using ALMA 1.2 mm fluxes (Scoville et al. 2023; Zhang et al. 2024). In Fig. 9, we compare these DSFGs with all HAE members confirmed by Pérez-Martínez et al. (2023), as well as the main sequence at the same redshift (Speagle et al. 2014). While these sources exhibit elevated star formation rates, the majority remain consistent with the high-mass end of the coeval star-forming main sequence within the 3σ scatter, showing no clear evidence for starburst activity. The elevated star formation is attributed to localized star-forming clumps, likely triggered by disk instabilities in combination with cold gas accretion and/or minor mergers, as evidenced by their irregular rest-frame UV morphologies.
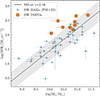 |
Fig. 9. Star-forming main sequence relation for the nine DSFG members. The reference main sequence relation at z = 2.16 is shown in black line and the corresponding 3σ scatter are marked with grey shaded region (Speagle et al. 2014). The blue solid circles represent the HAEs in the Spiderweb protocluster for a comparison (Pérez-Martínez et al. 2023). |
We visually inspect the DSFG sample to identify merger systems and assess the role of mergers in driving star formation within the Spiderweb protocluster. ASW2DF.14 is classified as a late-stage merger based on the presence of two distinct components in the F410M image. This classification is supported by a lower reduced χ2 and cleaner residuals when fitting a dual Sérsic model, compared to a single-component fit. Another ongoing merger is ASW2DF.29, which exhibits an elongated disk morphology with a small blue companion to the south. The south-eastern edge of the disk appears disconnected from the central structure, possibly forming a tidal tail due to ongoing interaction. Notably, a significant offset of ∼4 kpc is observed between the dust and stellar components, suggesting a heavily obscured starburst region interacting with its northern companion. This spatial offset is unlikely to be caused by astrometric uncertainty, as the alignment between JWST and ALMA detections is consistent for most sources in our sample (Hodge et al. 2025).
We also identify ASW2DF.23 as a potential merger candidate, given its multiple star-forming clumps in the bluer bands and irregular morphology in all three filters. Given the presence of multiple satellites around the Spiderweb galaxy (Miley et al. 2006) and a prominent dusty companion to its west (as shown in Fig. 3), we also classify the Spiderweb galaxy as a merger candidate. With ten confirmed DSFG members in our sample, this yields a merger fraction of 20%, up to 30% when including the potential candidate. This estimate aligns with recent JWST-based studies of field DSFGs, which report a merger fraction of 20%, with an upper limit of 60% (Gillman et al. 2024; McKay et al. 2025; Ren et al. 2025). Similar merger fractions have also been observed among HAE populations in protocluster environments at comparable redshifts (Liu et al. 2023; Naufal et al. 2023). Earlier studies reported higher merger fractions of ∼50% or more in DSFGs (Chen et al. 2015; Stach et al. 2019), largely due to HST observations being limited to rest-frame UV wavelengths, where dust-obscured galaxies often appear morphologically disturbed, potentially biasing merger classifications.
These results suggest that mergers are not the prominent drivers of star formation or disk growth in DSFGs (McAlpine et al. 2019; Ren et al. 2025). Instead, intense star formation and the development of extended stellar disks may result from smooth accretion of cold gas along large-scale filaments, as supported by both simulations and observations (Dekel et al. 2009; Daddi et al. 2021; Umehata et al. 2025b). Indeed, the tight spatial associations between DSFGs and gas filaments traced by Lyα emission have been observed in a few galaxy overdensities (Umehata et al. 2019; Daddi et al. 2021). In addition to the morphological analysis in the three main filters corresponding to the rest-frame U, V, and J bands, we also measured sizes in the F405N filter, which is sensitive to ongoing star formation activity. The sizes measured in the F405N and F410M filters are found to be nearly identical, which suggests that the contribution of Paβ emission is relatively minor compared to the continuum emission in the F405N filter. This may also provide a natural explanation for why these DSFGs were not identified as Paβ emitters in our previous JWST studies (Shimakawa et al. 2024a; Pérez-Martínez et al. 2024). Moreover, DSFGs in protoclusters tend to exhibit larger stellar disks compared to their field counterparts (Wu et al. 2023; Crespo Gómez et al. 2024; Wang et al. 2025; Umehata et al. 2025a), indicating accelerated size evolution in dense environments (Esposito et al. 2025).
Simulations suggest that coherent angular momentum in inflowing gas can expand rotating disks and enhance stellar rotational velocities (Ceverino et al. 2010; Stewart et al. 2017; Umehata et al. 2025a). Conversely, counter-rotating or misaligned gas streams may disrupt existing disks and induce localized star-forming clumps, as seen in both this study and prior observations (Le Bail et al. 2024; Rujopakarn et al. 2023; Kalita et al. 2024; Wang et al. 2025; Umehata et al. 2025a). Nevertheless, we cannot rule out mergers as contributors to the mass and size buildup of DSFGs, with their influence likely varying across different protocluster evolutionary stages (Hopkins et al. 2009; Jian et al. 2012; Liu et al. 2023). A larger DSFG sample with spatially resolved kinematic measurements will be crucial to disentangle the dominant mechanisms shaping their evolution in overdense environments.
4.2. The possible fate of DSFG members
The hypothesis that high-redshift DSFGs are progenitors of massive elliptical galaxies in the local universe has been supported by both simulations (González et al. 2011; McAlpine et al. 2019) and observations (Hainline et al. 2011; Simpson et al. 2014; Toft et al. 2014; Ikarashi et al. 2015; Chen et al. 2016; Wilkinson et al. 2017; Stach et al. 2019), based on their consistent number densities and physical properties. Observational evidence from JWST (Chen et al. 2022; Le Bail et al. 2024; Gillman et al. 2024; McKinney et al. 2025) and ALMA (Gullberg et al. 2019; Hodge et al. 2025) has revealed the presence of stellar bulges in high-redshift DSFGs, though these bulges generally do not dominate the total stellar mass compared to the extended disk components.
In our sample, ASW2DF.12–located just 180 kpc from the Spiderweb galaxy–exhibits a prominent stellar bulge component, as indicated by a best-fitting Sérsic index of 2.7 in F410M filter and supported by an X-ray detection (Tozzi et al. 2022a). We propose that this source may represent an early stage of bulge formation in DSFGs within a protocluster environment. Additionally, five DSFG members (ASW2DF.05, 20, 23, 28, 29) show weak but distinct point-like light concentrations superimposed on their stellar disks (see Fig. 3). Such central concentrations may be driven by accretion of cold gas with counter-rotating or perpendicular angular momentum, leading to angular momentum loss and compact central starbursts (Scannapieco et al. 2009; Sales et al. 2012; Aumer & White 2013; Dubois et al. 2014; Daikuhara et al. 2024). Alternatively, these point-like components might signify early AGN activity. Recent studies of X-ray-detected HAEs in the Spiderweb protocluster reveal similar compact cores as potential indicators of AGN feedback (Shimakawa et al. 2025). Although the central brightness in our sample is less pronounced than in the X-ray-detected HAEs, it suggests that these DSFGs may represent progenitor phases of HAE populations situated closer to the cluster core. Their stellar disks are likely fueled by cold gas accretion, while their centres may host growing black holes that contribute to the observed central light excess.
These findings are consistent with the inside-out evolutionary scenario Shimakawa et al. (2018), Sun et al. (2024), in which the Spiderweb protocluster is in a maturing phase. Its core already hosts several quiescent galaxies (Naufal et al. 2024), along with nascent ICM (Tozzi et al. 2022b; Di Mascolo et al. 2023; Lepore et al. 2024) and emerging AGN feedback observed in some HAEs (Shimakawa et al. 2024b). In contrast, DSFGs located at the protocluster outskirts could continue their vigorous star formation, likely fueled by cold gas accretion along surrounding large-scale filaments (Zhang et al. 2024). This spatial trend is also evident in Fig. 1, where ASW2DF.12, located within r500, may reflect a more advanced stage of AGN-regulated evolution, while most DSFGs reside in the outer regions of the protocluster–likely experiencing an earlier phase of AGN feedback.
We speculate that the directionality of gas inflows may play a role in shaping galaxy morphology and star formation. In particular, inflows aligned with the disk could potentially lead to size growth and clumpy disk structures, whereas misaligned or perpendicular inflows might instead trigger compact central starbursts. We note, however, that this interpretation is speculative, as we do not have direct evidence for the direction of gas inflows in our sample. As these DSFGs gradually migrate towards the protocluster centre, their stellar cores are expected to grow further through sustained gas accretion, eventually giving rise to bulge-dominated systems (Tan et al. 2024; Han et al. 2024). On the other hand, enhanced AGN feedback coupled with gas overconsumption may begin to suppress their star formation activities and drive them towards quenching (Pérez-Martínez et al. 2025; Remus & Kimmig 2025; Kimmig et al. 2025). Moreover, the elevated galaxy density near the protocluster centre increases the likelihood of interactions such as mergers and ram-pressure stripping (Dannerbauer et al. 2017), processes that can disrupt disk structures and facilitate the transformation of DSFGs into massive elliptical galaxies, as observed in a forming cluster at similar redshift (Xu et al. 2025).
5. Summary
In this paper, we present JWST/NIRCam imaging of ALMA-detected DSFGs within the Spiderweb protocluster at z = 2.16. Three filter, F115W, F182M, and F410, which correspond to rest-frame U, V, and J bands at the redshift of the protocluster, will be used for our analysis. Our main results are summarized as follows:
-
Within the JWST footprint, 30 sources from the ALMA main catalogue are covered, of which 22 are successfully detected by JWST, yielding a detection rate of 73%. By cross-matching with catalogues of various source populations, we identify ten JWST-detected ALMA sources as confirmed members of the protocluster, including the central Spiderweb radio galaxy.
-
Most of the DSFG members appear very red in both colour-composite images and the rest-frame UVJ diagram, highlighting the heavily dust-obscured nature of these ALMA-detected galaxies. Non-parametric morphological analysis places the majority of DSFGs within the late-type disk region of the Gini–M20 plane. Median morphological measurements shift towards the merger regime from longer to shorter wavelengths, indicating that the young stellar populations traced by rest-frame UV emission are more clumpy and disturbed.
-
Parametric morphological analysis indicates that DSFG members in the Spiderweb protocluster host larger stellar disks with comparable Sérsic indices relative to coeval DSFG samples. Their sizes lie systematically above the typical size–mass relation in both rest-frame optical and NIR wavelengths, pointing to an accelerated size evolution in overdense environments. Furthermore, we identify a downsizing trend in stellar components from rest-frame UV to NIR, with stellar sizes exceeding those of the dust components traced by ALMA. While our results generally align with recent studies (Gillman et al. 2024; Hodge et al. 2025), the moderately steep gradient seen in our DSFG sample may indicate enhanced outer-disk star formation. Yet, this conclusion remains tentative due to the limited sample size and possible selection differences, and will require confirmation with larger, mass-complete datasets.
-
The extended stellar disks observed in these DSFGs may arise from the smooth accretion of cold gas streams with coherent angular momentum from surrounding large-scale filaments, suggesting a secular pathway in their size and mass growth. As these DSFGs migrate towards the protocluster centre, We speculate that they may undergo bulge growth possibly driven by counter-rotating or perpendicular cold gas accretion, and could also be affected by AGN feedback, mergers, and ram-pressure stripping (Xu et al. 2025), eventually evolving into massive elliptical galaxies similar to those in the local Universe.
Future JWST/NIRISS and ALMA spectroscopic observations will help confirm additional dusty members in the Spiderweb protocluster and refine our understanding of their morphologies and spatial distributions, further testing environmental effects. The combination with Lyα three-dimensional mapping may help clarify how cosmic gas accretion shapes galaxy morphology in the Spiderweb protocluster as a function of radial distance from the central galaxy.
Acknowledgments
This research is based on observations made with the NASA/ESA James Webb Space Telescope obtained from the Space Telescope Science Institute, which is operated by the Association of Universities for Research in Astronomy, Inc., under NASA contract NAS 5–26555. These observations are associated with the JWST/NIRCam program ID#1572, PI: H. Dannerbauer. NIRCam was built by a team at the University of Arizona (UofA) and Lockheed Martin’s Advanced Technology Center, led by Prof. Marcia Rieke at UoA. This paper makes use of the following ALMA data: ADS/JAO.ALMA#2021.1.00435.S ALMA is a partnership of ESO (representing its member states), NSF (USA) and NINS (Japan), together with NRC (Canada), MOST and ASIAA (Taiwan), and KASI (Republic of Korea), in cooperation with the Republic of Chile. The Joint ALMA Observatory is operated by ESO, AUI/NRAO and NAOJ. The National Radio Astronomy Observatory is a facility of the National Science Foundation operated under cooperative agreement by Associated Universities, Inc. This work is supported by the National Key Research and Development Program of China (2023YFA1608100); the National Science Foundation of China (NSFC, Grant No. 12233005); the China Manned Space Program (Grant Nos. CMS-CSST-2025-A08 and CMS-CSST-2025-A20); and the Office of Science and Technology, Shanghai Municipal Government (Grant Nos. 24DX1400100, ZJ2023-ZD-001). YZ acknowledges the support from the China Scholarship Council (202206340048), and the National Science Foundation of Jiangsu Province (BK20231106). HD, YZ, JMPM and ZC acknowledges financial supports from the Agencia Estatal de Investigación del Ministerio de Ciencia e Innovación (AEIMCINN) under grant (La evolución de los cúmulos de galaxias desde el amanecer hasta el mediodía cósmico) with reference (PID2019105776GB-I00/DOI:10.13039/501100011033). In addition, HD, YZ and JMPM acknowledge support from the Agencia Estatal de Investigación del Ministerio de Ciencia, Innovación y Universidades (MCIU/AEI) under grant (Construcción de cúmulos de galaxias en formación a través de la formación estelar oscurecida por el polvo) and the European Regional Development Fund (ERDF) with reference (PID2022-143243NB-I00/10.13039/501100011033). JMPM acknowledges funding from the European Union’s Horizon-Europe research and innovation programme under the Marie Sklodowska-Curie grant agreement No 101106626. YK, and TK acknowledge support from JSPS KAKENHI Grant Number 23H01219. KD acknowledges financial support from JSPS KAKENHI Grant Numbers 25K23411. CDE acknowledges funding from the MCIN/AEI (Spain) and the “NextGenerationEU”/PRTR (European Union) through the Juan de la Cierva-Formación program (FJC2021-047307-I), as well as funding from LabEx UnivEarthS project N9. TK acknowledges financial support from JSPS KAKENHI Grant Numbers 24H00002 (Specially Promoted Research by T. Kodama et al.), 22K21349 (International Leading Research by S. Miyazaki et al.), and JSPS Core-to-Core Program (JPJSCCA20210003; M. Yoshida et al.). J.N. acknowledge the support of the National Science Centre, Poland through the SONATA BIS grant 2018/30/E/ST9/00208. J.N. acknowledges the support of the Polish National Agency for Academic Exchange (NAWA) Bekker grant BPN/BEK/2023/1/00271, and the kind hospitality of the IAC. PGP-G acknowledges support from grant PID2022-139567NB-I00 funded by Spanish Ministerio de Ciencia, Innovación y Universidades MICIU/AEI/10.13039/501100011033, and the European Union FEDER program Una manera de hacer Europa.
References
- Abraham, R. G., van den Bergh, S., & Nair, P. 2003, ApJ, 588, 218 [NASA ADS] [CrossRef] [Google Scholar]
- Amvrosiadis, A., Wardlow, J. L., Birkin, J. E., et al. 2025, MNRAS, 536, 3757 [Google Scholar]
- Arrigoni Battaia, F., Chen, C.-C., Fumagalli, M., et al. 2018, A&A, 620, A202 [NASA ADS] [CrossRef] [EDP Sciences] [Google Scholar]
- Aumer, M., & White, S. D. M. 2013, MNRAS, 428, 1055 [CrossRef] [Google Scholar]
- Bell, E. F., McIntosh, D. H., Katz, N., & Weinberg, M. D. 2003, ApJS, 149, 289 [Google Scholar]
- Bershady, M. A., Jangren, A., & Conselice, C. J. 2000, AJ, 119, 2645 [NASA ADS] [CrossRef] [Google Scholar]
- Birkin, J. E., Puglisi, A., Swinbank, A. M., et al. 2024, MNRAS, 531, 61 [NASA ADS] [CrossRef] [Google Scholar]
- Blain, A. W., Smail, I., Ivison, R. J., Kneib, J. P., & Frayer, D. T. 2002, Phys. Rep., 369, 111 [Google Scholar]
- Blain, A. W., Chapman, S. C., Smail, I., & Ivison, R. 2004, ApJ, 611, 725 [NASA ADS] [CrossRef] [Google Scholar]
- Boogaard, L. A., Gillman, S., Melinder, J., et al. 2024, ApJ, 969, 27 [NASA ADS] [CrossRef] [Google Scholar]
- Bouwens, R., González-López, J., Aravena, M., et al. 2020, ApJ, 902, 112 [NASA ADS] [CrossRef] [Google Scholar]
- Brammer, G. B., Whitaker, K. E., van Dokkum, P. G., et al. 2011, ApJ, 739, 24 [NASA ADS] [CrossRef] [Google Scholar]
- Calistro Rivera, G., Hodge, J. A., Smail, I., et al. 2018, ApJ, 863, 56 [Google Scholar]
- Calvi, R., Castignani, G., & Dannerbauer, H. 2023, A&A, 678, A15 [NASA ADS] [CrossRef] [EDP Sciences] [Google Scholar]
- CASA Team (Bean, B., et al.) 2022, PASP, 134, 114501 [NASA ADS] [CrossRef] [Google Scholar]
- Casey, C. M. 2016, ApJ, 824, 36 [CrossRef] [Google Scholar]
- Casey, C. M., Narayanan, D., & Cooray, A. 2014, Phys. Rep., 541, 45 [Google Scholar]
- Casey, C. M., Akins, H. B., Shuntov, M., et al. 2024, ApJ, 965, 98 [NASA ADS] [CrossRef] [Google Scholar]
- Ceverino, D., Dekel, A., & Bournaud, F. 2010, MNRAS, 404, 2151 [NASA ADS] [Google Scholar]
- Chabrier, G. 2003, PASP, 115, 763 [Google Scholar]
- Chapman, S. C., Blain, A. W., Smail, I., & Ivison, R. J. 2005, ApJ, 622, 772 [NASA ADS] [CrossRef] [Google Scholar]
- Chen, C.-C., Smail, I., Swinbank, A. M., et al. 2015, ApJ, 799, 194 [NASA ADS] [CrossRef] [Google Scholar]
- Chen, C.-C., Smail, I., Ivison, R. J., et al. 2016, ApJ, 820, 82 [NASA ADS] [CrossRef] [Google Scholar]
- Chen, C.-C., Hodge, J. A., Smail, I., et al. 2017, ApJ, 846, 108 [Google Scholar]
- Chen, C.-C., Harrison, C. M., Smail, I., et al. 2020, A&A, 635, A119 [NASA ADS] [CrossRef] [EDP Sciences] [Google Scholar]
- Chen, C.-C., Gao, Z.-K., Hsu, Q.-N., et al. 2022, ApJ, 939, L7 [NASA ADS] [CrossRef] [Google Scholar]
- Chen, Z., Dannerbauer, H., Lehnert, M. D., et al. 2024, MNRAS, 527, 8950 [Google Scholar]
- Cheng, C., Yan, H., Huang, J.-S., et al. 2022, ApJ, 936, L19 [NASA ADS] [CrossRef] [Google Scholar]
- Cheng, C., Huang, J.-S., Smail, I., et al. 2023, ApJ, 942, L19 [NASA ADS] [CrossRef] [Google Scholar]
- Cochrane, R. K., Hayward, C. C., Anglés-Alcázar, D., et al. 2019, MNRAS, 488, 1779 [NASA ADS] [CrossRef] [Google Scholar]
- Cochrane, R. K., Best, P. N., Smail, I., et al. 2021, MNRAS, 503, 2622 [NASA ADS] [CrossRef] [Google Scholar]
- Colina, L., Crespo Gómez, A., Álvarez-Márquez, J., et al. 2023, A&A, 673, L6 [NASA ADS] [CrossRef] [EDP Sciences] [Google Scholar]
- Conselice, C. J. 2003, ApJS, 147, 1 [NASA ADS] [CrossRef] [Google Scholar]
- Cowie, L. L., González-López, J., Barger, A. J., et al. 2018, ApJ, 865, 106 [NASA ADS] [CrossRef] [Google Scholar]
- Crespo Gómez, A., Colina, L., Álvarez-Márquez, J., et al. 2024, A&A, 691, A325 [NASA ADS] [CrossRef] [EDP Sciences] [Google Scholar]
- Croft, S., Kurk, J., van Breugel, W., et al. 2005, AJ, 130, 867 [NASA ADS] [CrossRef] [Google Scholar]
- da Cunha, E., Walter, F., Smail, I. R., et al. 2015, ApJ, 806, 110 [Google Scholar]
- Daddi, E., Valentino, F., Rich, R. M., et al. 2021, A&A, 649, A78 [NASA ADS] [CrossRef] [EDP Sciences] [Google Scholar]
- Daikuhara, K., Kodama, T., Pérez-Martínez, J. M., et al. 2024, MNRAS, 531, 2335 [NASA ADS] [CrossRef] [Google Scholar]
- Dannerbauer, H., Kurk, J. D., De Breuck, C., et al. 2014, A&A, 570, A55 [NASA ADS] [CrossRef] [EDP Sciences] [Google Scholar]
- Dannerbauer, H., Lehnert, M. D., Emonts, B., et al. 2017, A&A, 608, A48 [NASA ADS] [CrossRef] [EDP Sciences] [Google Scholar]
- Dannerbauer, H., Koyama, Y., Jin, S., et al. 2021, Mapping, Resolving and Penetrating into the Dusty Spiderweb Protocluster with Unqiue Pa-beta Imaging, JWST Proposal. Cycle 1, 1572 [Google Scholar]
- Dekel, A., Birnboim, Y., Engel, G., et al. 2009, Nature, 457, 451 [Google Scholar]
- Di Mascolo, L., Saro, A., Mroczkowski, T., et al. 2023, Nature, 615, 809 [NASA ADS] [CrossRef] [Google Scholar]
- Ding, X., Silverman, J., Treu, T., et al. 2020, ApJ, 888, 37 [NASA ADS] [CrossRef] [Google Scholar]
- Ding, X., Birrer, S., Treu, T., & Silverman, J. D. 2021, ArXiv e-prints [arXiv:2111.08721] [Google Scholar]
- Ding, X., Silverman, J. D., & Onoue, M. 2022, ApJ, 939, L28 [NASA ADS] [CrossRef] [Google Scholar]
- Ding, X., Onoue, M., Silverman, J. D., et al. 2023, Nature, 621, 51 [NASA ADS] [CrossRef] [Google Scholar]
- Dubois, Y., Pichon, C., Welker, C., et al. 2014, MNRAS, 444, 1453 [Google Scholar]
- Dudzevičiūtė, U., Smail, I., Swinbank, A. M., et al. 2020, MNRAS, 494, 3828 [Google Scholar]
- Emonts, B. H. C., Lehnert, M. D., Villar-Martín, M., et al. 2016, Science, 354, 1128 [NASA ADS] [CrossRef] [Google Scholar]
- Emonts, B. H. C., Lehnert, M. D., Dannerbauer, H., et al. 2018, MNRAS, 477, L60 [NASA ADS] [CrossRef] [Google Scholar]
- Espejo Salcedo, J. M., Pastras, S., Vácha, J., et al. 2025, A&A, 700, A42 [NASA ADS] [CrossRef] [EDP Sciences] [Google Scholar]
- Esposito, M., Borgani, S., Strazzullo, V., et al. 2025, A&A, 697, A142 [NASA ADS] [CrossRef] [EDP Sciences] [Google Scholar]
- Finkelstein, S. L., Bagley, M. B., Ferguson, H. C., et al. 2023, ApJ, 946, L13 [NASA ADS] [CrossRef] [Google Scholar]
- Fujimoto, S., Ouchi, M., Kohno, K., et al. 2018, ApJ, 861, 7 [Google Scholar]
- Fujimoto, S., Bezanson, R., Labbe, I., et al. 2025, ApJS, 278, 45 [Google Scholar]
- Gillman, S., Gullberg, B., Brammer, G., et al. 2023, A&A, 676, A26 [NASA ADS] [CrossRef] [EDP Sciences] [Google Scholar]
- Gillman, S., Smail, I., Gullberg, B., et al. 2024, A&A, 691, A299 [NASA ADS] [CrossRef] [EDP Sciences] [Google Scholar]
- Gómez-Guijarro, C., Toft, S., Karim, A., et al. 2018, ApJ, 856, 121 [Google Scholar]
- González, J. E., Lacey, C. G., Baugh, C. M., & Frenk, C. S. 2011, MNRAS, 413, 749 [Google Scholar]
- Greve, T. R., Stern, D., Ivison, R. J., et al. 2007, MNRAS, 382, 48 [NASA ADS] [CrossRef] [Google Scholar]
- Gullberg, B., Smail, I., Swinbank, A. M., et al. 2019, MNRAS, 490, 4956 [Google Scholar]
- Hainline, L. J., Blain, A. W., Smail, I., et al. 2011, ApJ, 740, 96 [NASA ADS] [CrossRef] [Google Scholar]
- Han, S., Jang, J. K., Contini, E., et al. 2024, ApJ, 977, 116 [Google Scholar]
- Hickox, R. C., Wardlow, J. L., Smail, I., et al. 2012, MNRAS, 421, 284 [NASA ADS] [Google Scholar]
- Hodge, J. A., & da Cunha, E. 2020, Roy. Soc. Open Sci., 7, 200556 [NASA ADS] [CrossRef] [Google Scholar]
- Hodge, J. A., Carilli, C. L., Walter, F., et al. 2012, ApJ, 760, 11 [Google Scholar]
- Hodge, J. A., Swinbank, A. M., Simpson, J. M., et al. 2016, ApJ, 833, 103 [Google Scholar]
- Hodge, J. A., Smail, I., Walter, F., et al. 2019, ApJ, 876, 130 [Google Scholar]
- Hodge, J. A., da Cunha, E., Kendrew, S., et al. 2025, ApJ, 978, 165 [NASA ADS] [CrossRef] [Google Scholar]
- Hopkins, A. M., & Beacom, J. F. 2006, ApJ, 651, 142 [NASA ADS] [CrossRef] [Google Scholar]
- Hopkins, P. F., Cox, T. J., Younger, J. D., & Hernquist, L. 2009, ApJ, 691, 1168 [NASA ADS] [CrossRef] [Google Scholar]
- Huang, S., Umehata, H., Smail, I., et al. 2025, A&A, 699, A324 [NASA ADS] [CrossRef] [EDP Sciences] [Google Scholar]
- Ikarashi, S., Ivison, R. J., Caputi, K. I., et al. 2015, ApJ, 810, 133 [Google Scholar]
- Ito, K., Valentino, F., Brammer, G., et al. 2024, ApJ, 964, 192 [CrossRef] [Google Scholar]
- Ji, Z., Williams, C. C., Suess, K. A., et al. 2024, ArXiv e-prints [arXiv:2401.00934] [Google Scholar]
- Jian, H.-Y., Lin, L., & Chiueh, T. 2012, ApJ, 754, 26 [NASA ADS] [CrossRef] [Google Scholar]
- Jin, S., Dannerbauer, H., Emonts, B., et al. 2021, A&A, 652, A11 [NASA ADS] [CrossRef] [EDP Sciences] [Google Scholar]
- Kalita, B. S., Silverman, J. D., Daddi, E., et al. 2024, ApJ, 960, 25 [NASA ADS] [CrossRef] [Google Scholar]
- Kamieneski, P. S., Frye, B. L., Pascale, M., et al. 2023, ApJ, 955, 91 [NASA ADS] [CrossRef] [Google Scholar]
- Kawinwanichakij, L., Silverman, J. D., Ding, X., et al. 2021, ApJ, 921, 38 [NASA ADS] [CrossRef] [Google Scholar]
- Kimmig, L. C., Remus, R.-S., Seidel, B., et al. 2025, ApJ, 979, 15 [Google Scholar]
- Koyama, Y., Kodama, T., Tadaki, K.-I., et al. 2013, MNRAS, 428, 1551 [NASA ADS] [CrossRef] [Google Scholar]
- Koyama, Y., Dannerbauer, H., Calvi, R., et al. 2022, A Complete Census of Quiescent Galaxies in the Dense Core of the Spiderweb Protocluster at z = 2.16, HST Proposal. Cycle 30, 17117 [Google Scholar]
- Kriek, M., van der Wel, A., van Dokkum, P. G., Franx, M., & Illingworth, G. D. 2008, ApJ, 682, 896 [NASA ADS] [CrossRef] [Google Scholar]
- Kuiper, E., Hatch, N. A., Miley, G. K., et al. 2011, MNRAS, 415, 2245 [NASA ADS] [CrossRef] [Google Scholar]
- Kurk, J. D., Röttgering, H. J. A., Pentericci, L., et al. 2000, A&A, 358, L1 [NASA ADS] [Google Scholar]
- Kurk, J. D., Pentericci, L., Röttgering, H. J. A., & Miley, G. K. 2004a, A&A, 428, 793 [NASA ADS] [CrossRef] [EDP Sciences] [Google Scholar]
- Kurk, J. D., Pentericci, L., Overzier, R. A., Röttgering, H. J. A., & Miley, G. K. 2004b, A&A, 428, 817 [NASA ADS] [CrossRef] [EDP Sciences] [Google Scholar]
- Lang, P., Schinnerer, E., Smail, I., et al. 2019, ApJ, 879, 54 [Google Scholar]
- Le Bail, A., Daddi, E., Elbaz, D., et al. 2024, A&A, 688, A53 [NASA ADS] [CrossRef] [EDP Sciences] [Google Scholar]
- Lelli, F., Di Teodoro, E. M., Fraternali, F., et al. 2021, Science, 371, 713 [Google Scholar]
- Lepore, M., Di Mascolo, L., Tozzi, P., et al. 2024, A&A, 682, A186 [NASA ADS] [CrossRef] [EDP Sciences] [Google Scholar]
- Ling, C., & Yan, H. 2022, ApJ, 929, 40 [CrossRef] [Google Scholar]
- Liu, S., Zheng, X. Z., Shi, D. D., et al. 2023, MNRAS, 523, 2422 [CrossRef] [Google Scholar]
- Liu, Z., Silverman, J. D., Daddi, E., et al. 2024, ApJ, 968, 15 [NASA ADS] [CrossRef] [Google Scholar]
- Lotz, J. M., Primack, J., & Madau, P. 2004, AJ, 128, 163 [NASA ADS] [CrossRef] [Google Scholar]
- Lotz, J. M., Jonsson, P., Cox, T. J., & Primack, J. R. 2008, MNRAS, 391, 1137 [Google Scholar]
- Lutz, D., Dunlop, J. S., Almaini, O., et al. 2001, A&A, 378, 70 [NASA ADS] [CrossRef] [EDP Sciences] [Google Scholar]
- Madau, P., & Dickinson, M. 2014, ARA&A, 52, 415 [Google Scholar]
- Magnelli, B., Gómez-Guijarro, C., Elbaz, D., et al. 2023, A&A, 678, A83 [NASA ADS] [CrossRef] [EDP Sciences] [Google Scholar]
- Martorano, M., van der Wel, A., Baes, M., et al. 2024, ApJ, 972, 134 [Google Scholar]
- McAlpine, S., Smail, I., Bower, R. G., et al. 2019, MNRAS, 488, 2440 [NASA ADS] [CrossRef] [Google Scholar]
- McKay, S. J., Barger, A. J., Cowie, L. L., & Nicandro Rosenthal, M. J. 2025, ApJ, 988, 135 [Google Scholar]
- McKinney, J., Casey, C. M., Long, A. S., et al. 2025, ApJ, 979, 229 [Google Scholar]
- Miley, G. K., Overzier, R. A., Zirm, A. W., et al. 2006, ApJ, 650, L29 [NASA ADS] [CrossRef] [Google Scholar]
- Naufal, A., Koyama, Y., Shimakawa, R., & Kodama, T. 2023, ApJ, 958, 170 [NASA ADS] [CrossRef] [Google Scholar]
- Naufal, A., Koyama, Y., D’Eugenio, C., et al. 2024, ApJ, 977, 58 [Google Scholar]
- Overzier, R. A. 2016, A&ARv, 24, 14 [Google Scholar]
- Peng, C. Y., Ho, L. C., Impey, C. D., & Rix, H.-W. 2002, AJ, 124, 266 [Google Scholar]
- Pentericci, L., Roettgering, H. J. A., Miley, G. K., Carilli, C. L., & McCarthy, P. 1997, A&A, 326, 580 [Google Scholar]
- Pentericci, L., Kurk, J. D., Röttgering, H. J. A., et al. 2000, A&A, 361, L25 [NASA ADS] [Google Scholar]
- Pentericci, L., Kurk, J. D., Carilli, C. L., et al. 2002, A&A, 396, 109 [NASA ADS] [CrossRef] [EDP Sciences] [Google Scholar]
- Pérez-González, P. G., Rinaldi, P., Caputi, K. I., et al. 2024, ApJ, 969, L10 [Google Scholar]
- Pérez-Martínez, J. M., Dannerbauer, H., Kodama, T., et al. 2023, MNRAS, 518, 1707 [Google Scholar]
- Pérez-Martínez, J. M., Dannerbauer, H., Koyama, Y., et al. 2024, ApJ, 977, 74 [Google Scholar]
- Pérez-Martínez, J. M., Dannerbauer, H., Emonts, B. H. C., et al. 2025, A&A, 696, A236 [NASA ADS] [CrossRef] [EDP Sciences] [Google Scholar]
- Perrin, M. D., Soummer, R., Elliott, E. M., Lallo, M. D., & Sivaramakrishnan, A. 2012, SPIE Conf. Ser., 8442, 84423D [NASA ADS] [Google Scholar]
- Perrin, M. D., Sivaramakrishnan, A., Lajoie, C.-P., et al. 2014, SPIE Conf. Ser., 9143, 91433X [NASA ADS] [Google Scholar]
- Polletta, M., Frye, B. L., Garuda, N., et al. 2024, A&A, 690, A285 [NASA ADS] [CrossRef] [EDP Sciences] [Google Scholar]
- Popping, G., Pillepich, A., Calistro Rivera, G., et al. 2022, MNRAS, 510, 3321 [CrossRef] [Google Scholar]
- Price, S. H., Suess, K. A., Williams, C. C., et al. 2025, ApJ, 980, 11 [Google Scholar]
- Remus, R.-S., & Kimmig, L. C. 2025, ApJ, 982, 30 [Google Scholar]
- Ren, J., Liu, F. S., Li, N., et al. 2024, ApJ, 969, 4 [NASA ADS] [CrossRef] [Google Scholar]
- Ren, J., Liu, F. S., Li, N., et al. 2025, ApJ, 982, 200 [Google Scholar]
- Rieke, M. J., Kelly, D., & Horner, S. 2005, SPIE Conf. Ser., 5904, 1 [NASA ADS] [Google Scholar]
- Rigby, E. E., Hatch, N. A., Röttgering, H. J. A., et al. 2014, MNRAS, 437, 1882 [NASA ADS] [CrossRef] [Google Scholar]
- Rizzo, F., Vegetti, S., Fraternali, F., Stacey, H. R., & Powell, D. 2021, MNRAS, 507, 3952 [NASA ADS] [CrossRef] [Google Scholar]
- Rodriguez-Gomez, V., Snyder, G. F., Lotz, J. M., et al. 2019, MNRAS, 483, 4140 [NASA ADS] [CrossRef] [Google Scholar]
- Roettgering, H. J. A., Lacy, M., Miley, G. K., Chambers, K. C., & Saunders, R. 1994, A&AS, 108, 79 [NASA ADS] [Google Scholar]
- Rujopakarn, W., Williams, C. C., Daddi, E., et al. 2023, ApJ, 948, L8 [NASA ADS] [CrossRef] [Google Scholar]
- Sales, L. V., Navarro, J. F., Theuns, T., et al. 2012, MNRAS, 423, 1544 [Google Scholar]
- Scannapieco, C., White, S. D. M., Springel, V., & Tissera, P. B. 2009, MNRAS, 396, 696 [NASA ADS] [CrossRef] [Google Scholar]
- Scoville, N., Faisst, A., Weaver, J., et al. 2023, ApJ, 943, 82 [NASA ADS] [CrossRef] [Google Scholar]
- Shimakawa, R., Kodama, T., Tadaki, K. I., et al. 2014, MNRAS, 441, L1 [NASA ADS] [CrossRef] [Google Scholar]
- Shimakawa, R., Koyama, Y., Röttgering, H. J. A., et al. 2018, MNRAS, 481, 5630 [NASA ADS] [CrossRef] [Google Scholar]
- Shimakawa, R., Pérez-Martínez, J. M., Dannerbauer, H., et al. 2024a, ApJ, 977, 73 [NASA ADS] [Google Scholar]
- Shimakawa, R., Pérez-Martínez, J. M., Koyama, Y., et al. 2024b, MNRAS, 528, 3679 [NASA ADS] [CrossRef] [Google Scholar]
- Shimakawa, R., Koyama, Y., Kodama, T., et al. 2025, MNRAS, 537, L36 [Google Scholar]
- Simpson, J. M., Swinbank, A. M., Smail, I., et al. 2014, ApJ, 788, 125 [Google Scholar]
- Simpson, J. M., Smail, I., Swinbank, A. M., et al. 2017, ApJ, 839, 58 [NASA ADS] [CrossRef] [Google Scholar]
- Smail, I., Ivison, R. J., Blain, A. W., & Kneib, J. P. 2002, MNRAS, 331, 495 [CrossRef] [Google Scholar]
- Smail, I., Dudzevičiūtė, U., Gurwell, M., et al. 2023, ApJ, 958, 36 [NASA ADS] [CrossRef] [Google Scholar]
- Snyder, G. F., Lotz, J., Moody, C., et al. 2015a, MNRAS, 451, 4290 [NASA ADS] [CrossRef] [Google Scholar]
- Snyder, G. F., Torrey, P., Lotz, J. M., et al. 2015b, MNRAS, 454, 1886 [NASA ADS] [CrossRef] [Google Scholar]
- Speagle, J. S., Steinhardt, C. L., Capak, P. L., & Silverman, J. D. 2014, ApJS, 214, 15 [Google Scholar]
- Spergel, D. N., Verde, L., Peiris, H. V., et al. 2003, ApJS, 148, 175 [Google Scholar]
- Spergel, D. N., Bean, R., Doré, O., et al. 2007, ApJS, 170, 377 [NASA ADS] [CrossRef] [Google Scholar]
- Stach, S. M., Dudzevičiūtė, U., Smail, I., et al. 2019, MNRAS, 487, 4648 [Google Scholar]
- Stewart, K. R., Maller, A. H., Oñorbe, J., et al. 2017, ApJ, 843, 47 [NASA ADS] [CrossRef] [Google Scholar]
- Suess, K. A., Bezanson, R., Nelson, E. J., et al. 2022, ApJ, 937, L33 [NASA ADS] [CrossRef] [Google Scholar]
- Sun, H., Wang, T., Xu, K., et al. 2024, ApJ, 967, L34 [NASA ADS] [CrossRef] [Google Scholar]
- Sun, F., Yang, J., Wang, F., et al. 2025, ArXiv e-prints [arXiv:2506.06418] [Google Scholar]
- Swinbank, A. M., Chapman, S. C., Smail, I., et al. 2006, MNRAS, 371, 465 [NASA ADS] [CrossRef] [Google Scholar]
- Swinbank, A. M., Smail, I., Chapman, S. C., et al. 2010, MNRAS, 405, 234 [NASA ADS] [Google Scholar]
- Swinbank, A. M., Simpson, J. M., Smail, I., et al. 2014, MNRAS, 438, 1267 [Google Scholar]
- Tadaki, K.-I., Belli, S., Burkert, A., et al. 2020, ApJ, 901, 74 [NASA ADS] [CrossRef] [Google Scholar]
- Tadaki, K.-I., Kodama, T., Koyama, Y., et al. 2023, ApJ, 957, L15 [NASA ADS] [CrossRef] [Google Scholar]
- Tamura, Y., Kohno, K., Nakanishi, K., et al. 2009, Nature, 459, 61 [NASA ADS] [CrossRef] [Google Scholar]
- Tan, Q.-H., Daddi, E., Magnelli, B., et al. 2024, Nature, 636, 69 [Google Scholar]
- Tanaka, M., Toft, S., Marchesini, D., et al. 2013, ApJ, 772, 113 [NASA ADS] [CrossRef] [Google Scholar]
- Targett, T. A., Dunlop, J. S., Cirasuolo, M., et al. 2013, MNRAS, 432, 2012 [NASA ADS] [CrossRef] [Google Scholar]
- Toft, S., Smolčić, V., Magnelli, B., et al. 2014, ApJ, 782, 68 [Google Scholar]
- Tozzi, P., Pentericci, L., Gilli, R., et al. 2022a, A&A, 662, A54 [NASA ADS] [CrossRef] [EDP Sciences] [Google Scholar]
- Tozzi, P., Gilli, R., Liu, A., et al. 2022b, A&A, 667, A134 [NASA ADS] [CrossRef] [EDP Sciences] [Google Scholar]
- Umehata, H., Fumagalli, M., Smail, I., et al. 2019, Science, 366, 97 [Google Scholar]
- Umehata, H., Steidel, C. C., Smail, I., et al. 2025a, PASJ, 77, 432 [Google Scholar]
- Umehata, H., Kubo, M., Smail, I., et al. 2025b, ArXiv e-prints [arXiv:2502.01868] [Google Scholar]
- Venkateshwaran, A., Weiss, A., Sulzenauer, N., et al. 2024, ApJ, 977, 161 [Google Scholar]
- Wang, S. X., Brandt, W. N., Luo, B., et al. 2013, ApJ, 778, 179 [NASA ADS] [CrossRef] [Google Scholar]
- Wang, G. C. P., Hill, R., Chapman, S. C., et al. 2021, MNRAS, 508, 3754 [NASA ADS] [CrossRef] [Google Scholar]
- Wang, W., Cantalupo, S., Pensabene, A., et al. 2025, Nat. Astron., 9, 710 [Google Scholar]
- Ward, E., de la Vega, A., Mobasher, B., et al. 2024, ApJ, 962, 176 [NASA ADS] [CrossRef] [Google Scholar]
- Wardlow, J. L., Smail, I., Coppin, K. E. K., et al. 2011, MNRAS, 415, 1479 [Google Scholar]
- Whitaker, K. E., Labbé, I., van Dokkum, P. G., et al. 2011, ApJ, 735, 86 [Google Scholar]
- Wilkinson, A., Almaini, O., Chen, C.-C., et al. 2017, MNRAS, 464, 1380 [NASA ADS] [CrossRef] [Google Scholar]
- Williams, R. J., Quadri, R. F., Franx, M., van Dokkum, P., & Labbé, I. 2009, ApJ, 691, 1879 [NASA ADS] [CrossRef] [Google Scholar]
- Williams, H., Kelly, P. L., Chen, W., et al. 2023, Science, 380, 416 [NASA ADS] [CrossRef] [Google Scholar]
- Wootten, A., & Thompson, A. R. 2009, IEEE Proc., 97, 1463 [NASA ADS] [CrossRef] [Google Scholar]
- Wu, Y., Cai, Z., Sun, F., et al. 2023, ApJ, 942, L1 [CrossRef] [Google Scholar]
- Xu, K., Wang, T., Daddi, E., et al. 2025, ArXiv e-prints [arXiv:2503.21724] [Google Scholar]
- Yang, L., Roberts-Borsani, G., Treu, T., et al. 2021, MNRAS, 501, 1028 [Google Scholar]
- Yang, L., Morishita, T., Leethochawalit, N., et al. 2022, ApJ, 938, L17 [NASA ADS] [CrossRef] [Google Scholar]
- Zavala, J. A., Casey, C. M., da Cunha, E., et al. 2018, ApJ, 869, 71 [Google Scholar]
- Zavala, J. A., Casey, C. M., Manning, S. M., et al. 2021, ApJ, 909, 165 [CrossRef] [Google Scholar]
- Zeballos, M., Aretxaga, I., Hughes, D. H., et al. 2018, MNRAS, 479, 4577 [Google Scholar]
- Zhang, Y., Zheng, X. Z., Shi, D. D., et al. 2022, MNRAS, 512, 4893 [NASA ADS] [CrossRef] [Google Scholar]
- Zhang, Y. H., Dannerbauer, H., Pérez-Martínez, J. M., et al. 2024, A&A, 692, A22 [NASA ADS] [CrossRef] [EDP Sciences] [Google Scholar]
- Zheng, X. Z., Bell, E. F., Somerville, R. S., et al. 2009, ApJ, 707, 1566 [NASA ADS] [CrossRef] [Google Scholar]
- Zhou, L., Wang, T., Daddi, E., et al. 2024a, A&A, 684, A196 [NASA ADS] [CrossRef] [EDP Sciences] [Google Scholar]
- Zhou, D., Greve, T. R., Gullberg, B., et al. 2024b, A&A, 690, A196 [NASA ADS] [CrossRef] [EDP Sciences] [Google Scholar]
- Zhuang, M.-Y., & Shen, Y. 2024, ApJ, 962, 139 [NASA ADS] [CrossRef] [Google Scholar]
Appendix A: Gallery of the eight ALMA sources undetected by JWST in the Spiderweb field.
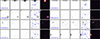 |
Fig. A.1. Gallery of the eight ALMA sources which are not detected by JWST/NIRCam. The cutout settings and layout are identical to those in Figure 3. |
Appendix B: Gallery of the 12 ALMA sources lack of redshift information.
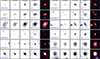 |
Fig. B.1. Gallery of the 12 sources detected by both ALMA and JWST/NIRCam, but are not confirmed to be members. The cutout settings and layout are identical to those in Figure 3. |
Appendix C: Morphological analysis of the 22 ALMA sources detected by JWST in the Spiderweb field.
Morphological properties of the nine DSFG members of the Spiderweb protocluster.
Morphological properties of the 12 ALMA sources lack of redshift information.
Appendix D: Validation of the mass-to-light ratio stellar-sass estimates
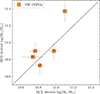 |
Fig. D.1. Comparison of UV–to–NIR SED-based stellar masses with the new mass-to-light estimates for the five ALMA-detected members with full multiwavelength coverage. Source IDs from Table 1 are indicated within each data point. |
Here we evaluate the robustness of the mass-to-light ratio approach used to derive the stellar masses for four of our nine spectroscopically confirmed ALMA-detected sources (excluding the Spiderweb Galaxy; see Sect. 3.4.2). We do so by comparing the stellar masses derived from mass-to-light ratios with those obtained from full SED fitting (Pérez-Martínez et al. 2023) for the five sources detected in up to ten photometric bands. Figure D.1 presents this comparison, together with a 1:1 reference line. The five sources (ASW2DF.05, 12, 20, 23, 28) lie close to this relation, with a mean offset of 0.13 dex and a 1σ scatter of 0.17 dex. This level of agreement demonstrates that our approach provides consistent stellar-mass estimates and supports its application to the remaining four sources (ASW2DF.04, 14, 29, 47) in our analysis (Sect. 3.4.2).
All Tables
Morphological properties of the nine DSFG members of the Spiderweb protocluster.
All Figures
|
Fig. 1. JWST colour-composite (F410M/F182M/F115W for RGB) image of the Spiderweb protocluster. The 22 ALMA sources detected by JWST and the eight undetected ones are marked with orange and white squares, respectively, with their IDs labelled nearby. The Spiderweb galaxy is marked as a star, which represents the centre of the protocluster. The dashed circle shows the r500 = 229 kpc derived from the recently detected Sunyaev–Zeldovich signal (Di Mascolo et al. 2023). |
| In the text | |
|
Fig. 2. Signal-to-noise ratio distribution of the 30 ALMA sources within the JWST/NIRCam footprint. The 22 sources detected by JWST are indicated in blue, while the eight undetected sources are shown in grey. |
| In the text | |
|
Fig. 3. Gallery of ten protocluster members detected by both ALMA and JWST/NIRCam, with a cutout size of 4 × 4 arcsec. The names of the four filters are shown in the first row. The ALMA 1.2 mm contours at [2σ, 3σ, 4σ] are overlaid on the F405N image in the fourth column for each source, with a blue bar showing a physical distance of 5 kpc. The RGB-composite (F410M/F182M/F115W) colour images are shown in the fifth column. The source IDs are positioned in the lower-left corner of each group of panels, consistent with the numbering in Fig. 1. |
| In the text | |
|
Fig. 4. Rest-frame UVJ (F410M, F182M, and F115W) diagram of the nine JWST-detected DSFG members, marked with their IDs. The criteria to separate the quiescent and star-forming regions are adopted from Whitaker et al. (2011). The normal star-forming galaxies and quiescent galaxies at z ∼ 2 − 3 from JWST/CEERS and JADES surveys are shown with grey dots (Ren et al. 2024). |
| In the text | |
|
Fig. 5. Gini-M20 diagram of nine DSFG members across the following three filters: F410M (red), F182M (green), and F115W (blue). The medians of the field DSFG sample are depicted as orange and lime diamonds in the rest-frame optical and NIR bands (Gillman et al. 2024). Three extremely dusty starburst at cosmic noon are also shown as magenta circles for a comparison (Polletta et al. 2024). |
| In the text | |
|
Fig. 6. Rest-frame near-infrared effective radii, measured from the F410M filter, are plotted against Sérsic indices for the nine DSFG members in the Spiderweb protocluster. For comparison, 27 (55) field DSFGs at z ∼ 1 − 1.5 (z ∼ 2 − 2.5) from the literature (Cheng et al. 2022, 2023; Boogaard et al. 2024; Price et al. 2025; Ren et al. 2025) are shown as violet and pink circles, respectively. The median values for each redshift bin, along with their median absolute deviations, are indicated by larger markers of the same colour with corresponding error bars. |
| In the text | |
|
Fig. 7. Left: Rest-frame optical size-mass relation of the nine DSFG members in the Spiderweb protocluster, with effective radii measured using the F182M filter. For comparison, HAEs from the BOSS1244/1542 (Liu et al. 2023) and Spiderweb protoclusters (Pérez-Martínez et al. 2023), as well as field DSFGs at similar redshifts (Ren et al. 2025), are shown. The optical size-mass relations of field star-forming and quiescent galaxies at z ∼ 2.2 are also included (Ward et al. 2024; Ji et al. 2024). Right: Rest-frame NIR size-mass relation of the nine DSFG members, measured using the F410M filter. Archival DSFG samples from recent JWST studies are presented for comparison (Cheng et al. 2022, 2023; Polletta et al. 2024; Price et al. 2025; Ren et al. 2025), along with the NIR (1.5 μm) size-mass relations of star-forming and quiescent galaxies at z ∼ 2 − 2.5 (Martorano et al. 2024). |
| In the text | |
|
Fig. 8. Size-wavelength relation of the nine DSFG members in the Spiderweb protocluster. The individual measurements and median values are marked as circles and stars with different colours for corresponding wavelengths. Field DSFG samples at similar redshifts from recent JWST studies are shown with different markers and colours for a comparison (Tadaki et al. 2023; Gillman et al. 2024; Price et al. 2025; Hodge et al. 2025; Ren et al. 2025). The green point at rest-frame 0.4 μm represents the extrapolated result from the slope and the size at rest-frame 1 μm in Gillman et al. (2024). Solid lines indicate the decreasing slopes from rest-frame UV to NIR, while dashed lines connect the JWST and ALMA size measurements in each sample. |
| In the text | |
|
Fig. 9. Star-forming main sequence relation for the nine DSFG members. The reference main sequence relation at z = 2.16 is shown in black line and the corresponding 3σ scatter are marked with grey shaded region (Speagle et al. 2014). The blue solid circles represent the HAEs in the Spiderweb protocluster for a comparison (Pérez-Martínez et al. 2023). |
| In the text | |
|
Fig. A.1. Gallery of the eight ALMA sources which are not detected by JWST/NIRCam. The cutout settings and layout are identical to those in Figure 3. |
| In the text | |
|
Fig. B.1. Gallery of the 12 sources detected by both ALMA and JWST/NIRCam, but are not confirmed to be members. The cutout settings and layout are identical to those in Figure 3. |
| In the text | |
|
Fig. D.1. Comparison of UV–to–NIR SED-based stellar masses with the new mass-to-light estimates for the five ALMA-detected members with full multiwavelength coverage. Source IDs from Table 1 are indicated within each data point. |
| In the text | |
Current usage metrics show cumulative count of Article Views (full-text article views including HTML views, PDF and ePub downloads, according to the available data) and Abstracts Views on Vision4Press platform.
Data correspond to usage on the plateform after 2015. The current usage metrics is available 48-96 hours after online publication and is updated daily on week days.
Initial download of the metrics may take a while.