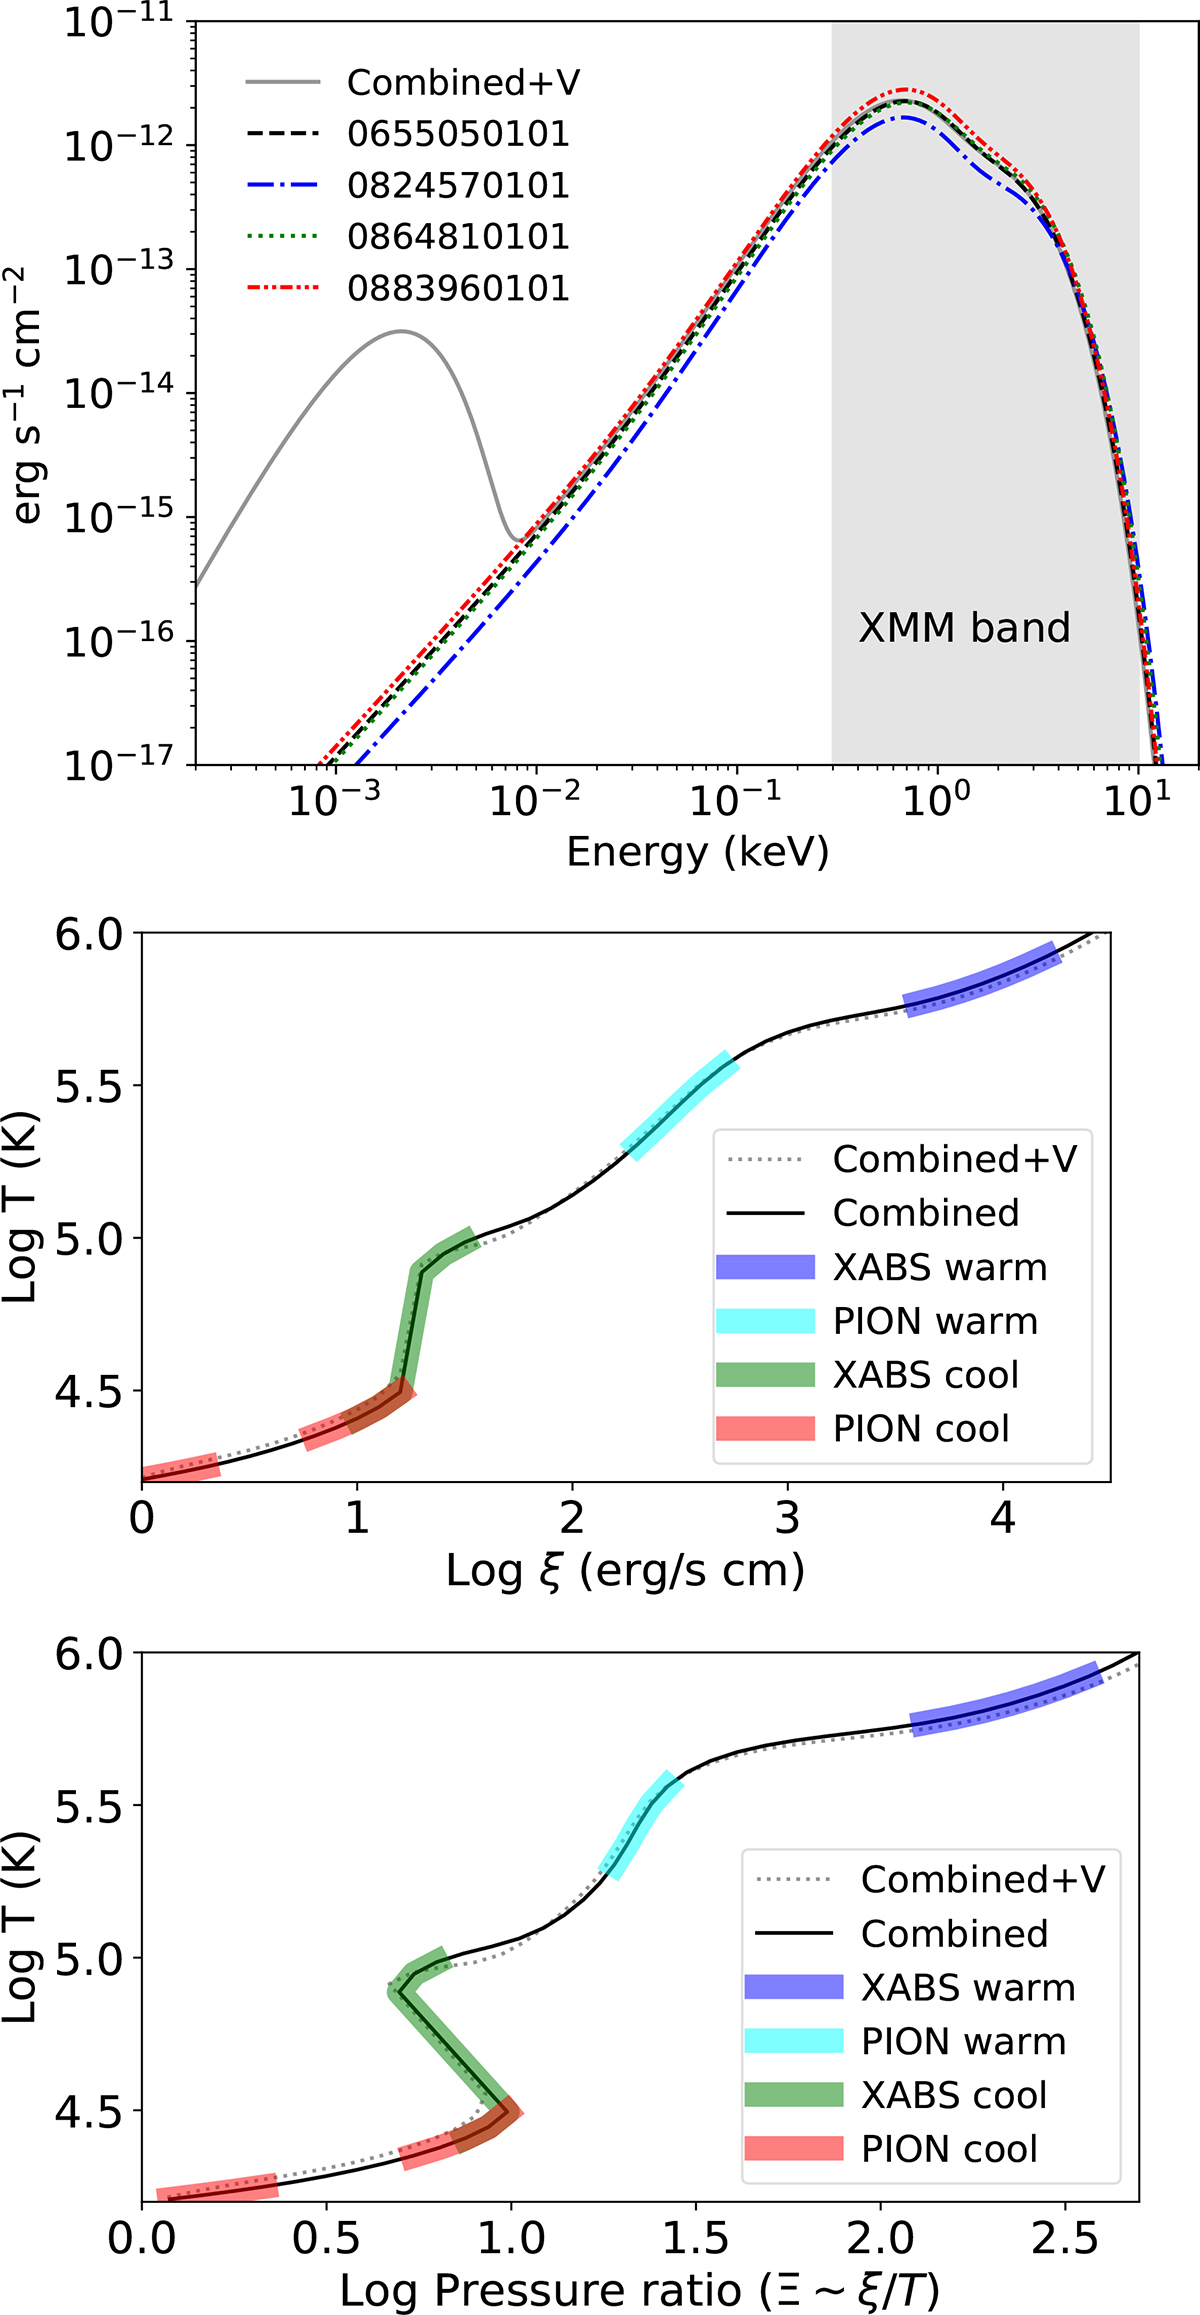
Fig. A.1.
Download original image
Spectral energy distribution (top panel), ionisation balance (middle panel), and stability curve (bottom panel). The band covered by XMM-Newton is shown in grey. Combined+V refers to the multi-wavelength SED built with XMM-Newton X-ray data and HST optical data. The ionisation balance and stability curves of the individual observations are not shown since they are almost superimposable. The best-fit ranges of the emission (pion) and absorption (xabs) line components obtained for the individual observations are shown as thicker segments (see Table 1).
Current usage metrics show cumulative count of Article Views (full-text article views including HTML views, PDF and ePub downloads, according to the available data) and Abstracts Views on Vision4Press platform.
Data correspond to usage on the plateform after 2015. The current usage metrics is available 48-96 hours after online publication and is updated daily on week days.
Initial download of the metrics may take a while.