Open Access
Fig. A.2.
Download original image
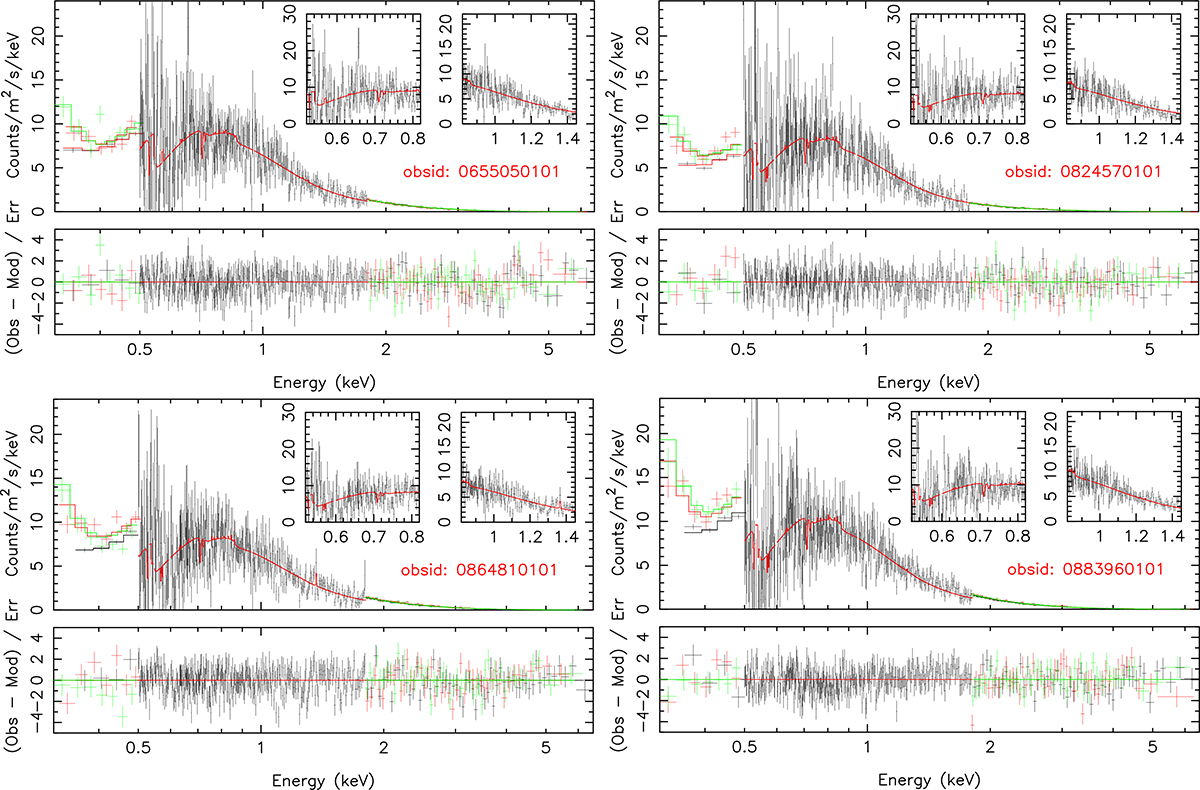
XMM-Newton spectra and continuum modelling of the individual observations. The labels are same as in Fig. 2. Only the first-order RGS spectrum is used due to the low statistics of the second-order individual spectra.
Current usage metrics show cumulative count of Article Views (full-text article views including HTML views, PDF and ePub downloads, according to the available data) and Abstracts Views on Vision4Press platform.
Data correspond to usage on the plateform after 2015. The current usage metrics is available 48-96 hours after online publication and is updated daily on week days.
Initial download of the metrics may take a while.