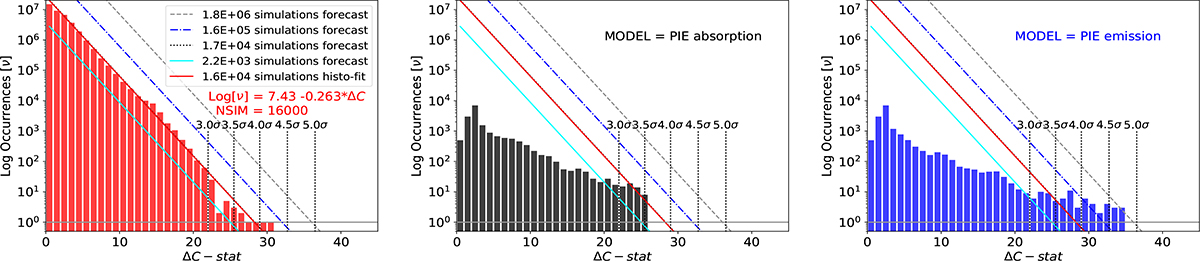
Fig. A.6.
Download original image
Monte Carlo simulations for significance estimates (left panel, red bars, template model: continuum model for ObsID 0655050101). Forecasts for more than 16,000 simulations are performed adopting a constant histogram slope. As a comparison the results for the xabs (middle panel, black bars) and the pion (right panel, blue bars) histograms for the real data are also shown.
Current usage metrics show cumulative count of Article Views (full-text article views including HTML views, PDF and ePub downloads, according to the available data) and Abstracts Views on Vision4Press platform.
Data correspond to usage on the plateform after 2015. The current usage metrics is available 48-96 hours after online publication and is updated daily on week days.
Initial download of the metrics may take a while.