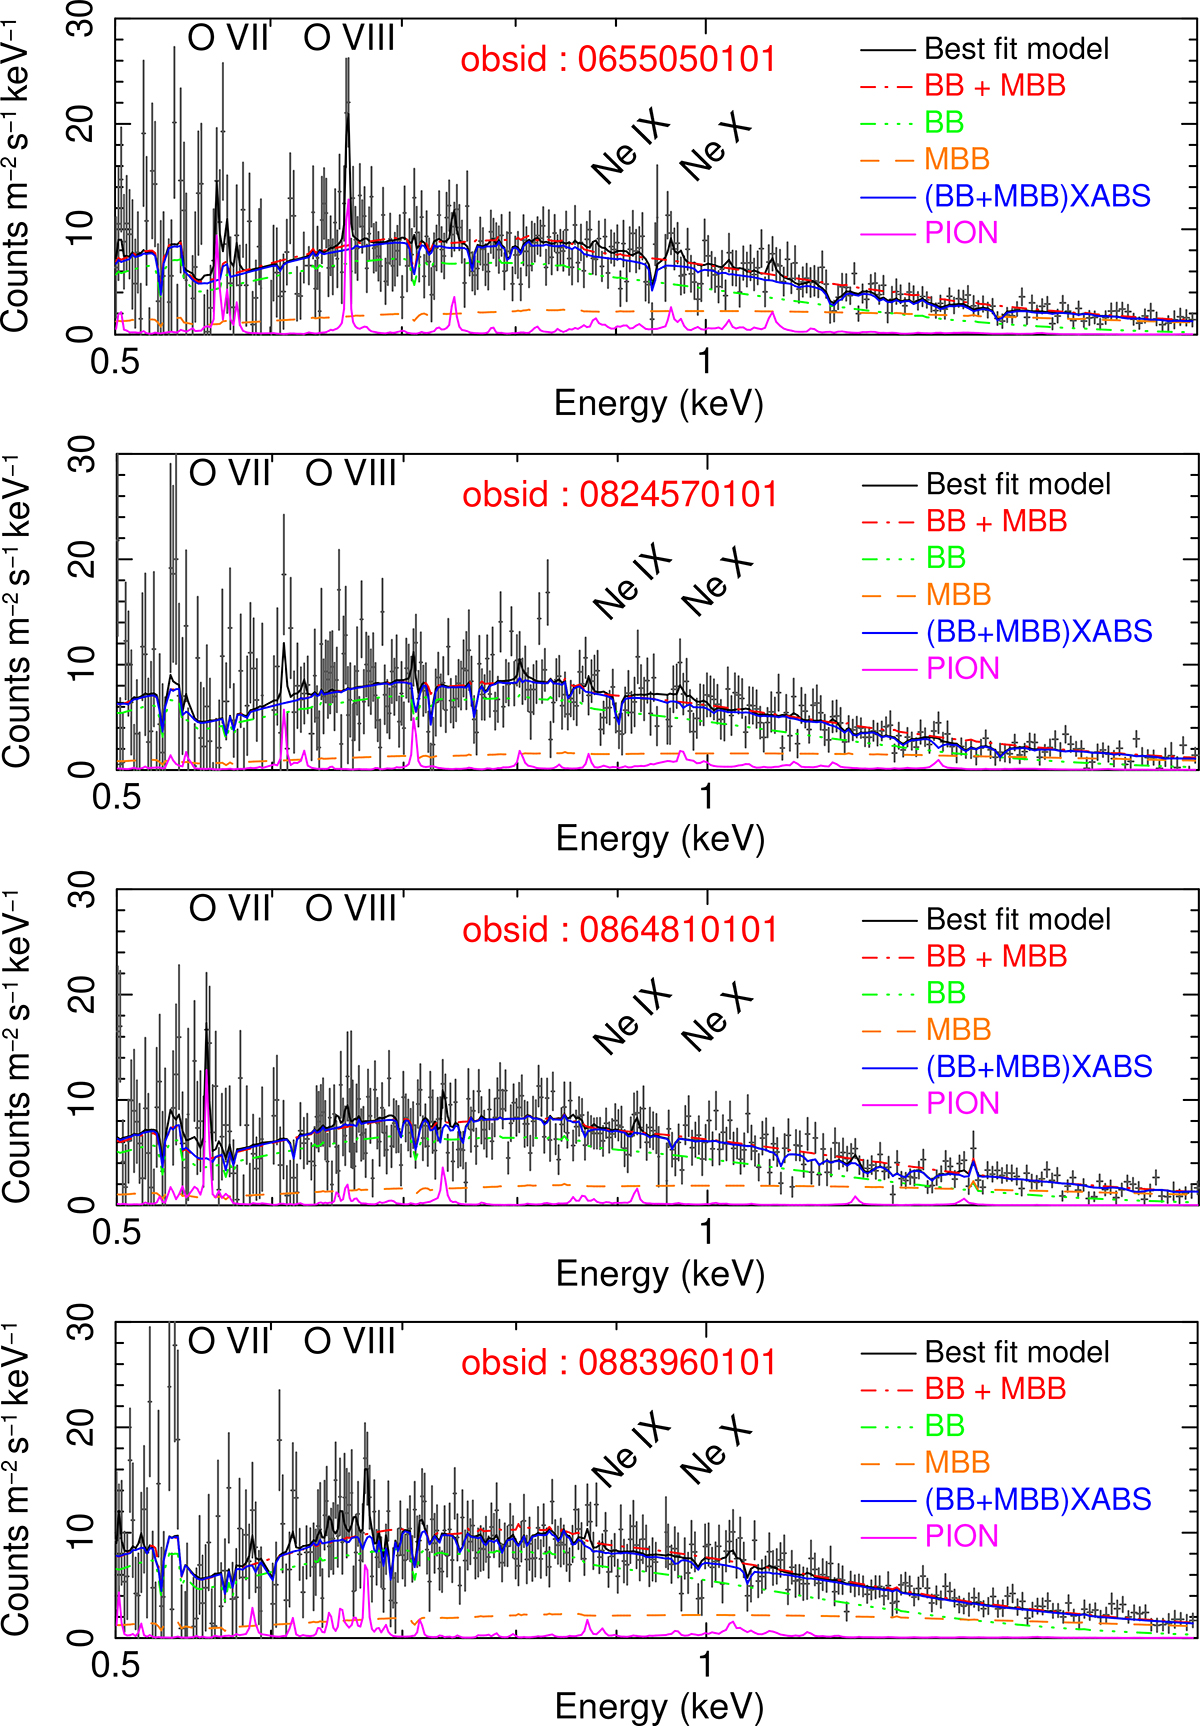
Fig. A.7.
Download original image
Detail of the main spectral components of the continuum (bb and mbb) and the plasma (xabs in absorption and pion in emission) zoomed in on the RGS spectra. The best-fit model of each spectrum is also shown in Table 1 and previously in Fig. A.5. The ISM contribution is present in each model. Labelled are the main ionic species for the soft X-ray emission in their rest frame (see also Fig. 2, 4 and 5).
Current usage metrics show cumulative count of Article Views (full-text article views including HTML views, PDF and ePub downloads, according to the available data) and Abstracts Views on Vision4Press platform.
Data correspond to usage on the plateform after 2015. The current usage metrics is available 48-96 hours after online publication and is updated daily on week days.
Initial download of the metrics may take a while.