Fig. 4.
Download original image
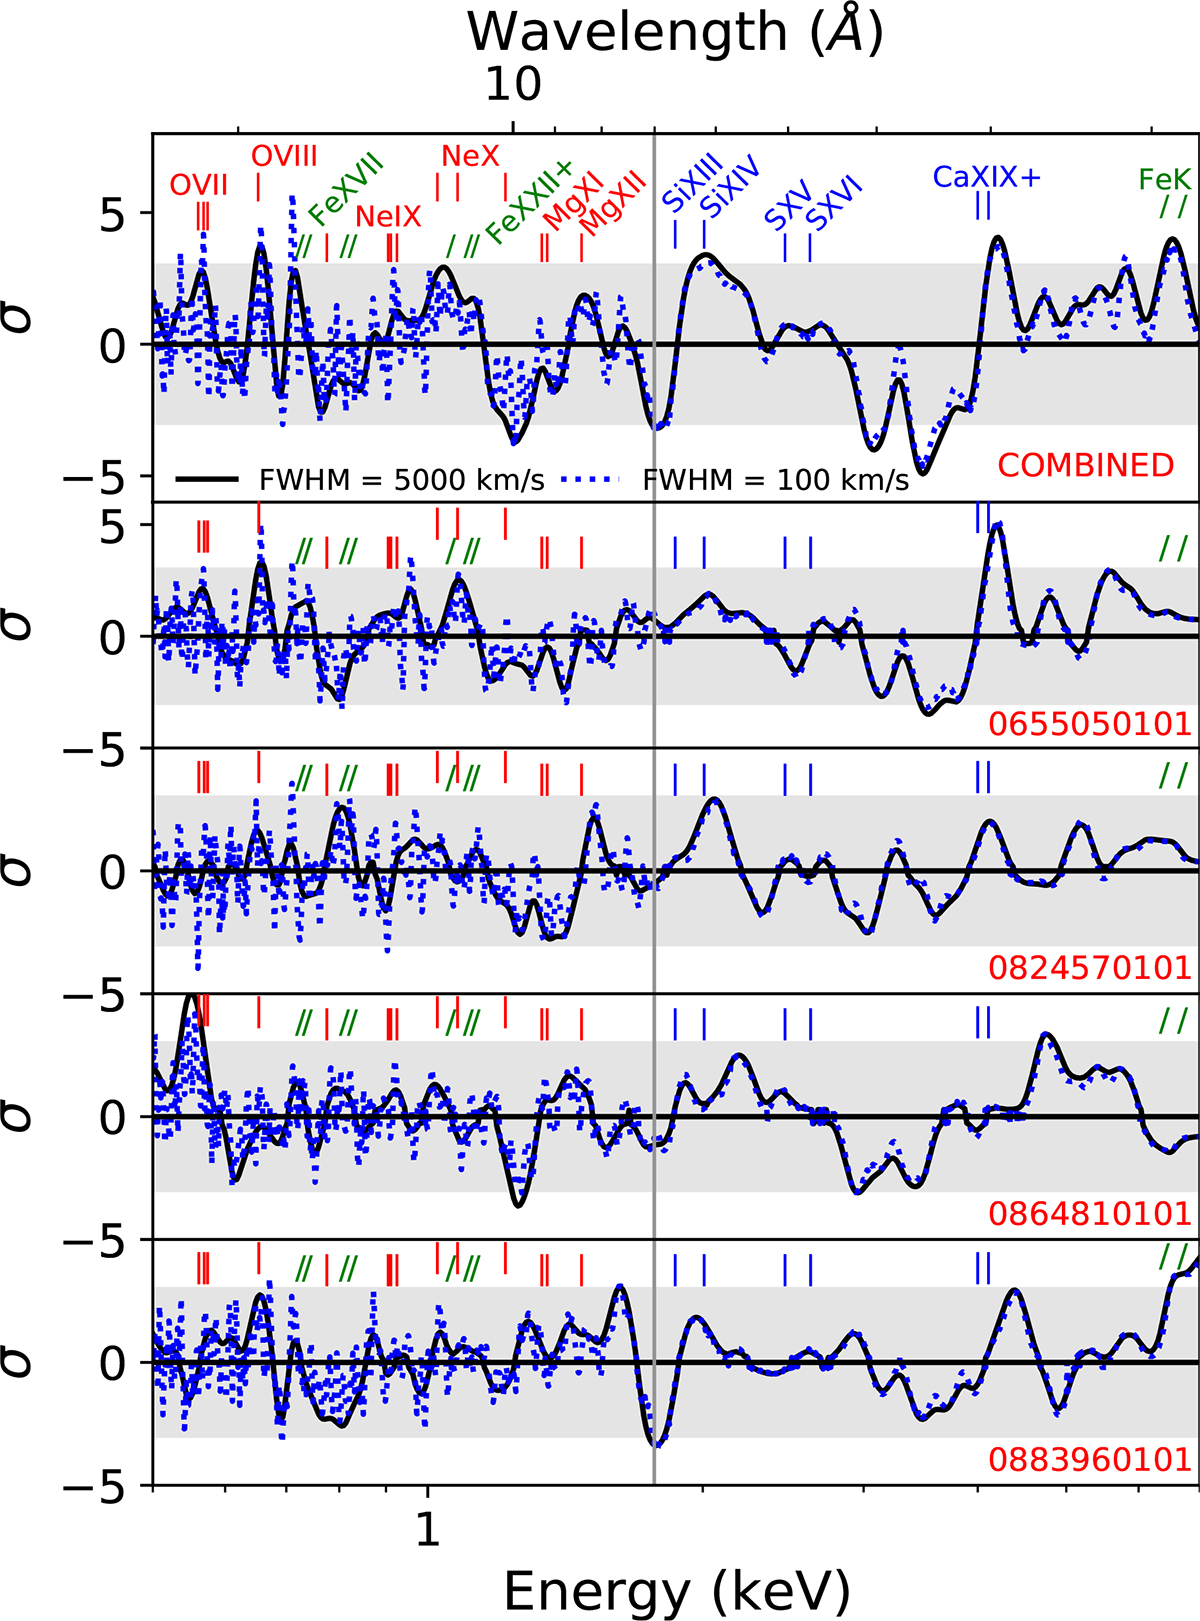
Gaussian line scan of the XMM-Newton time-averaged spectrum (top panel) and spectra of the individual observations. Labelled are the energy centroids of some of the most common X-ray spectral lines; Fe K refers to the Fe I fluorescence and the Fe XXV resonant lines. The grey vertical line indicates the separation between RGS and EPIC. The grey-shaded areas indicate the 3σ single-trial significance.
Current usage metrics show cumulative count of Article Views (full-text article views including HTML views, PDF and ePub downloads, according to the available data) and Abstracts Views on Vision4Press platform.
Data correspond to usage on the plateform after 2015. The current usage metrics is available 48-96 hours after online publication and is updated daily on week days.
Initial download of the metrics may take a while.